
 |
|||||||||||||||
 |
|||||||||||||||
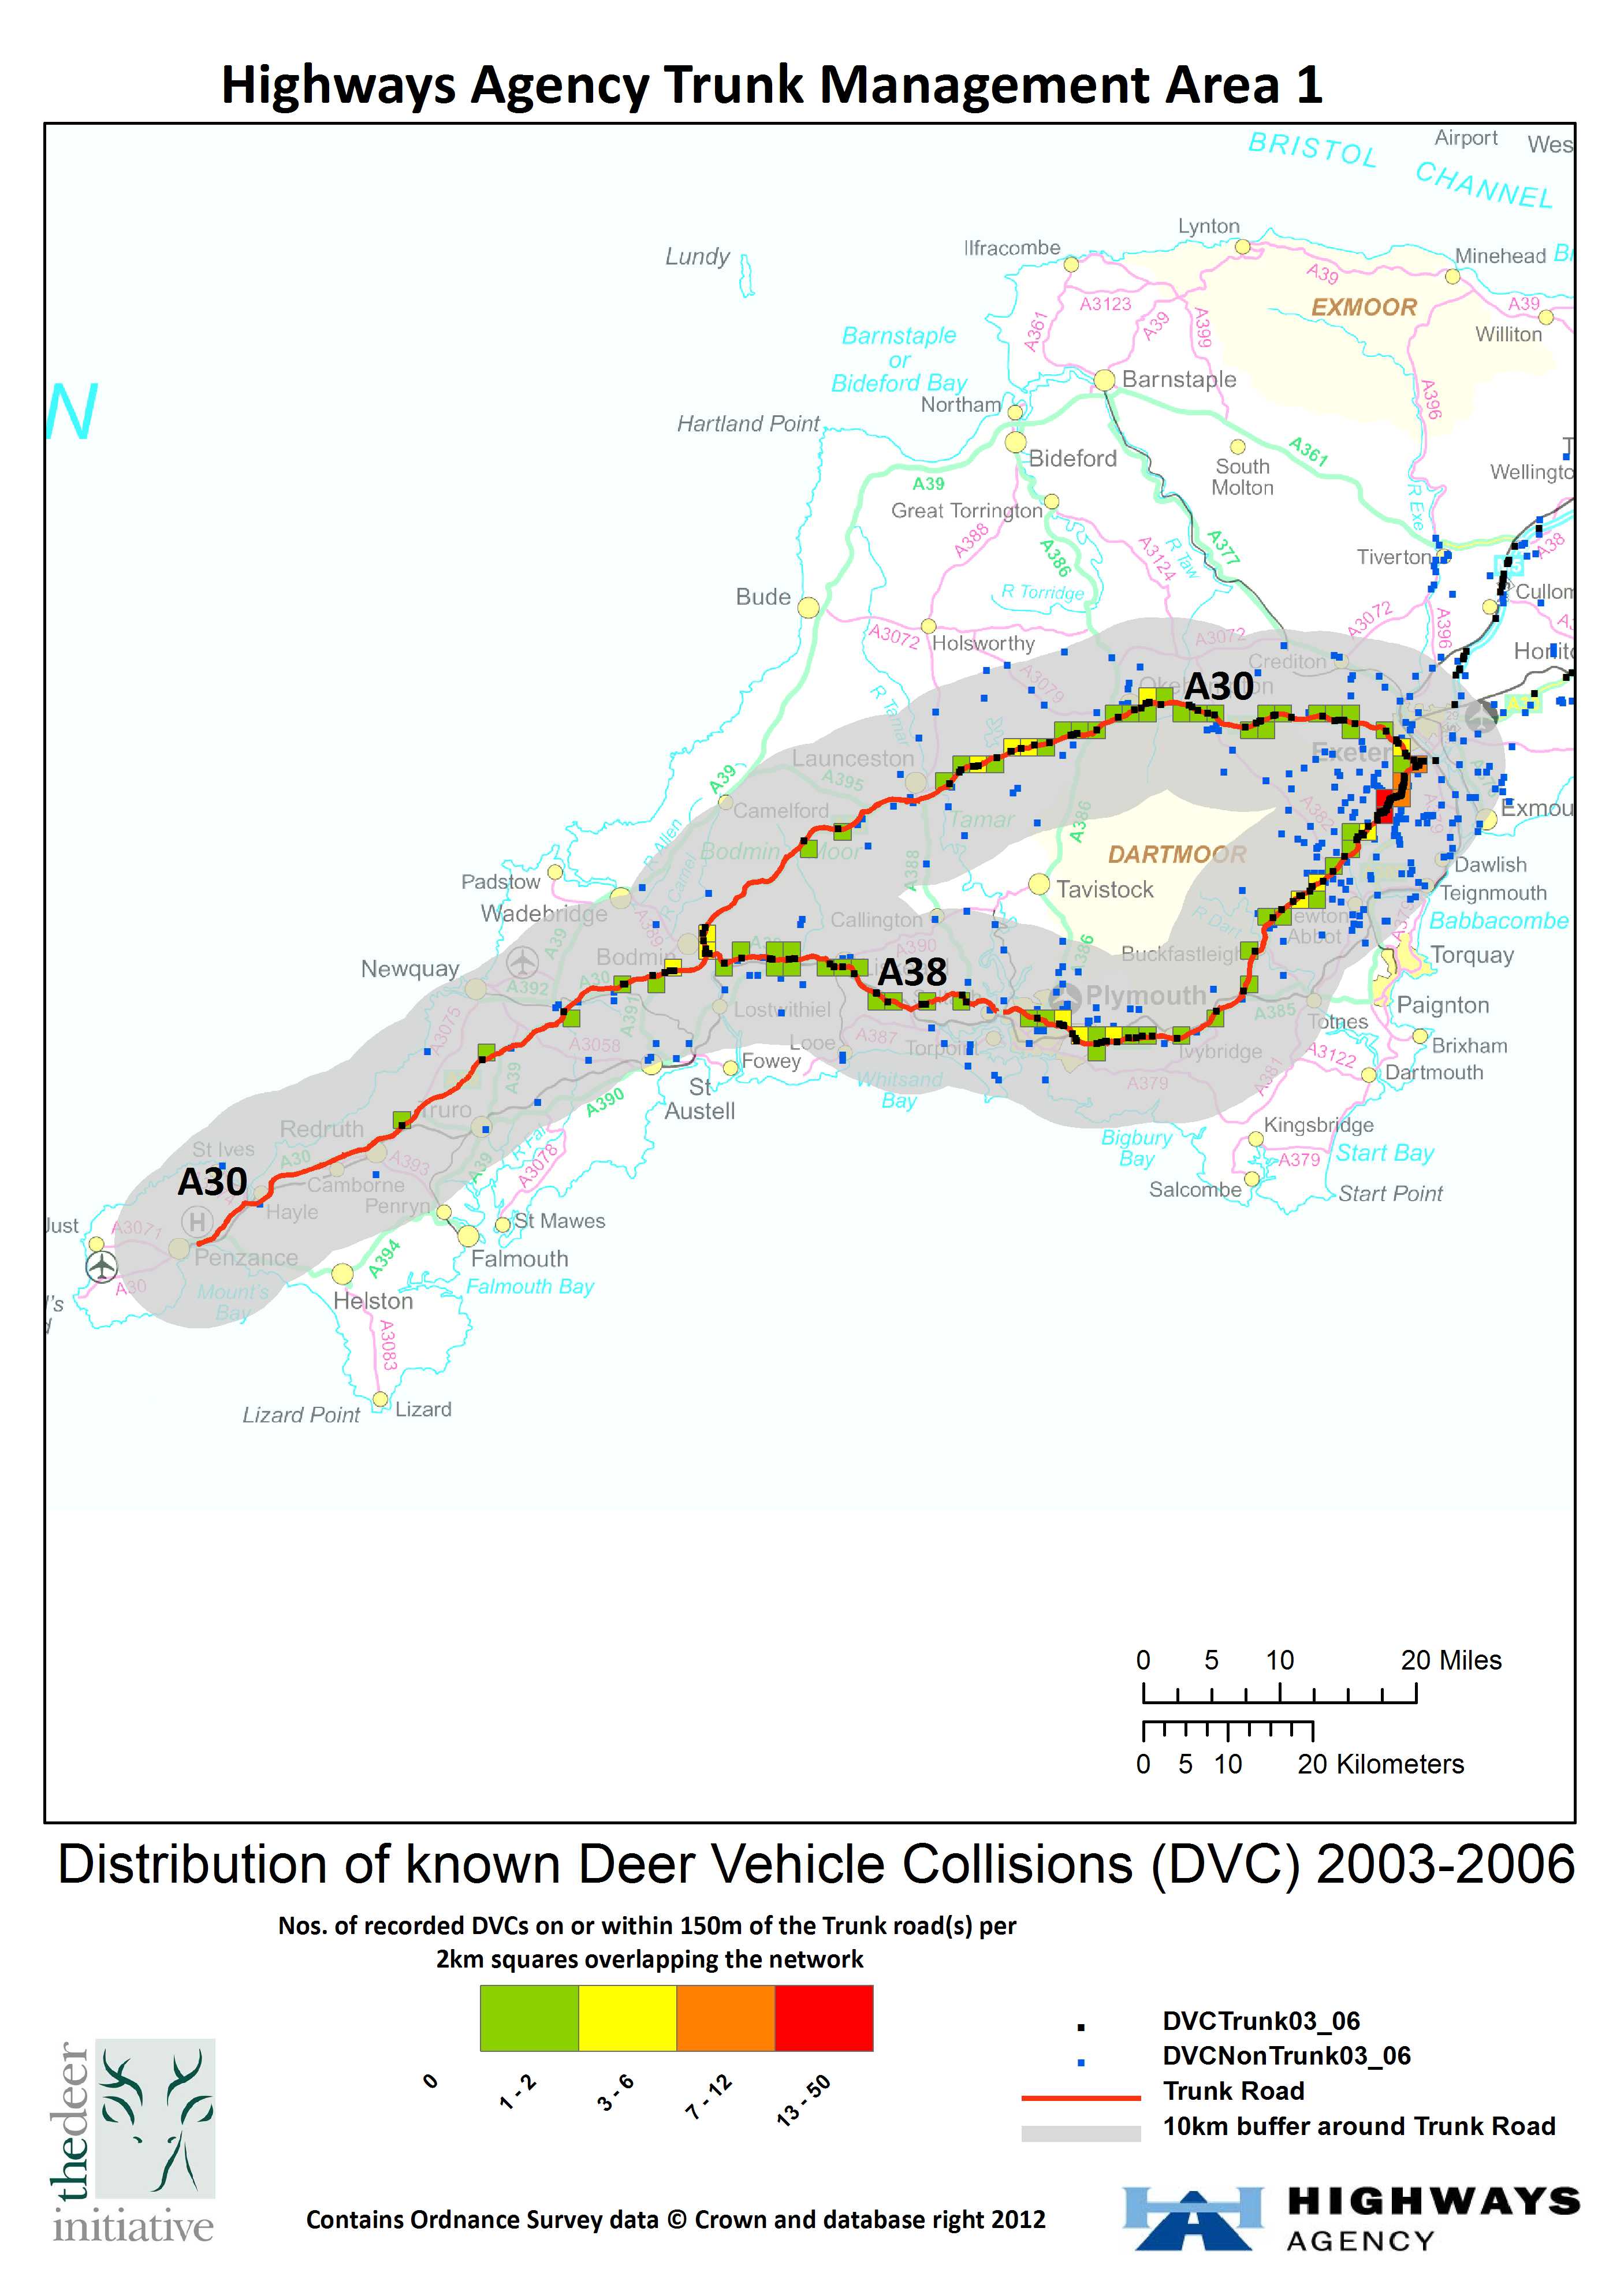
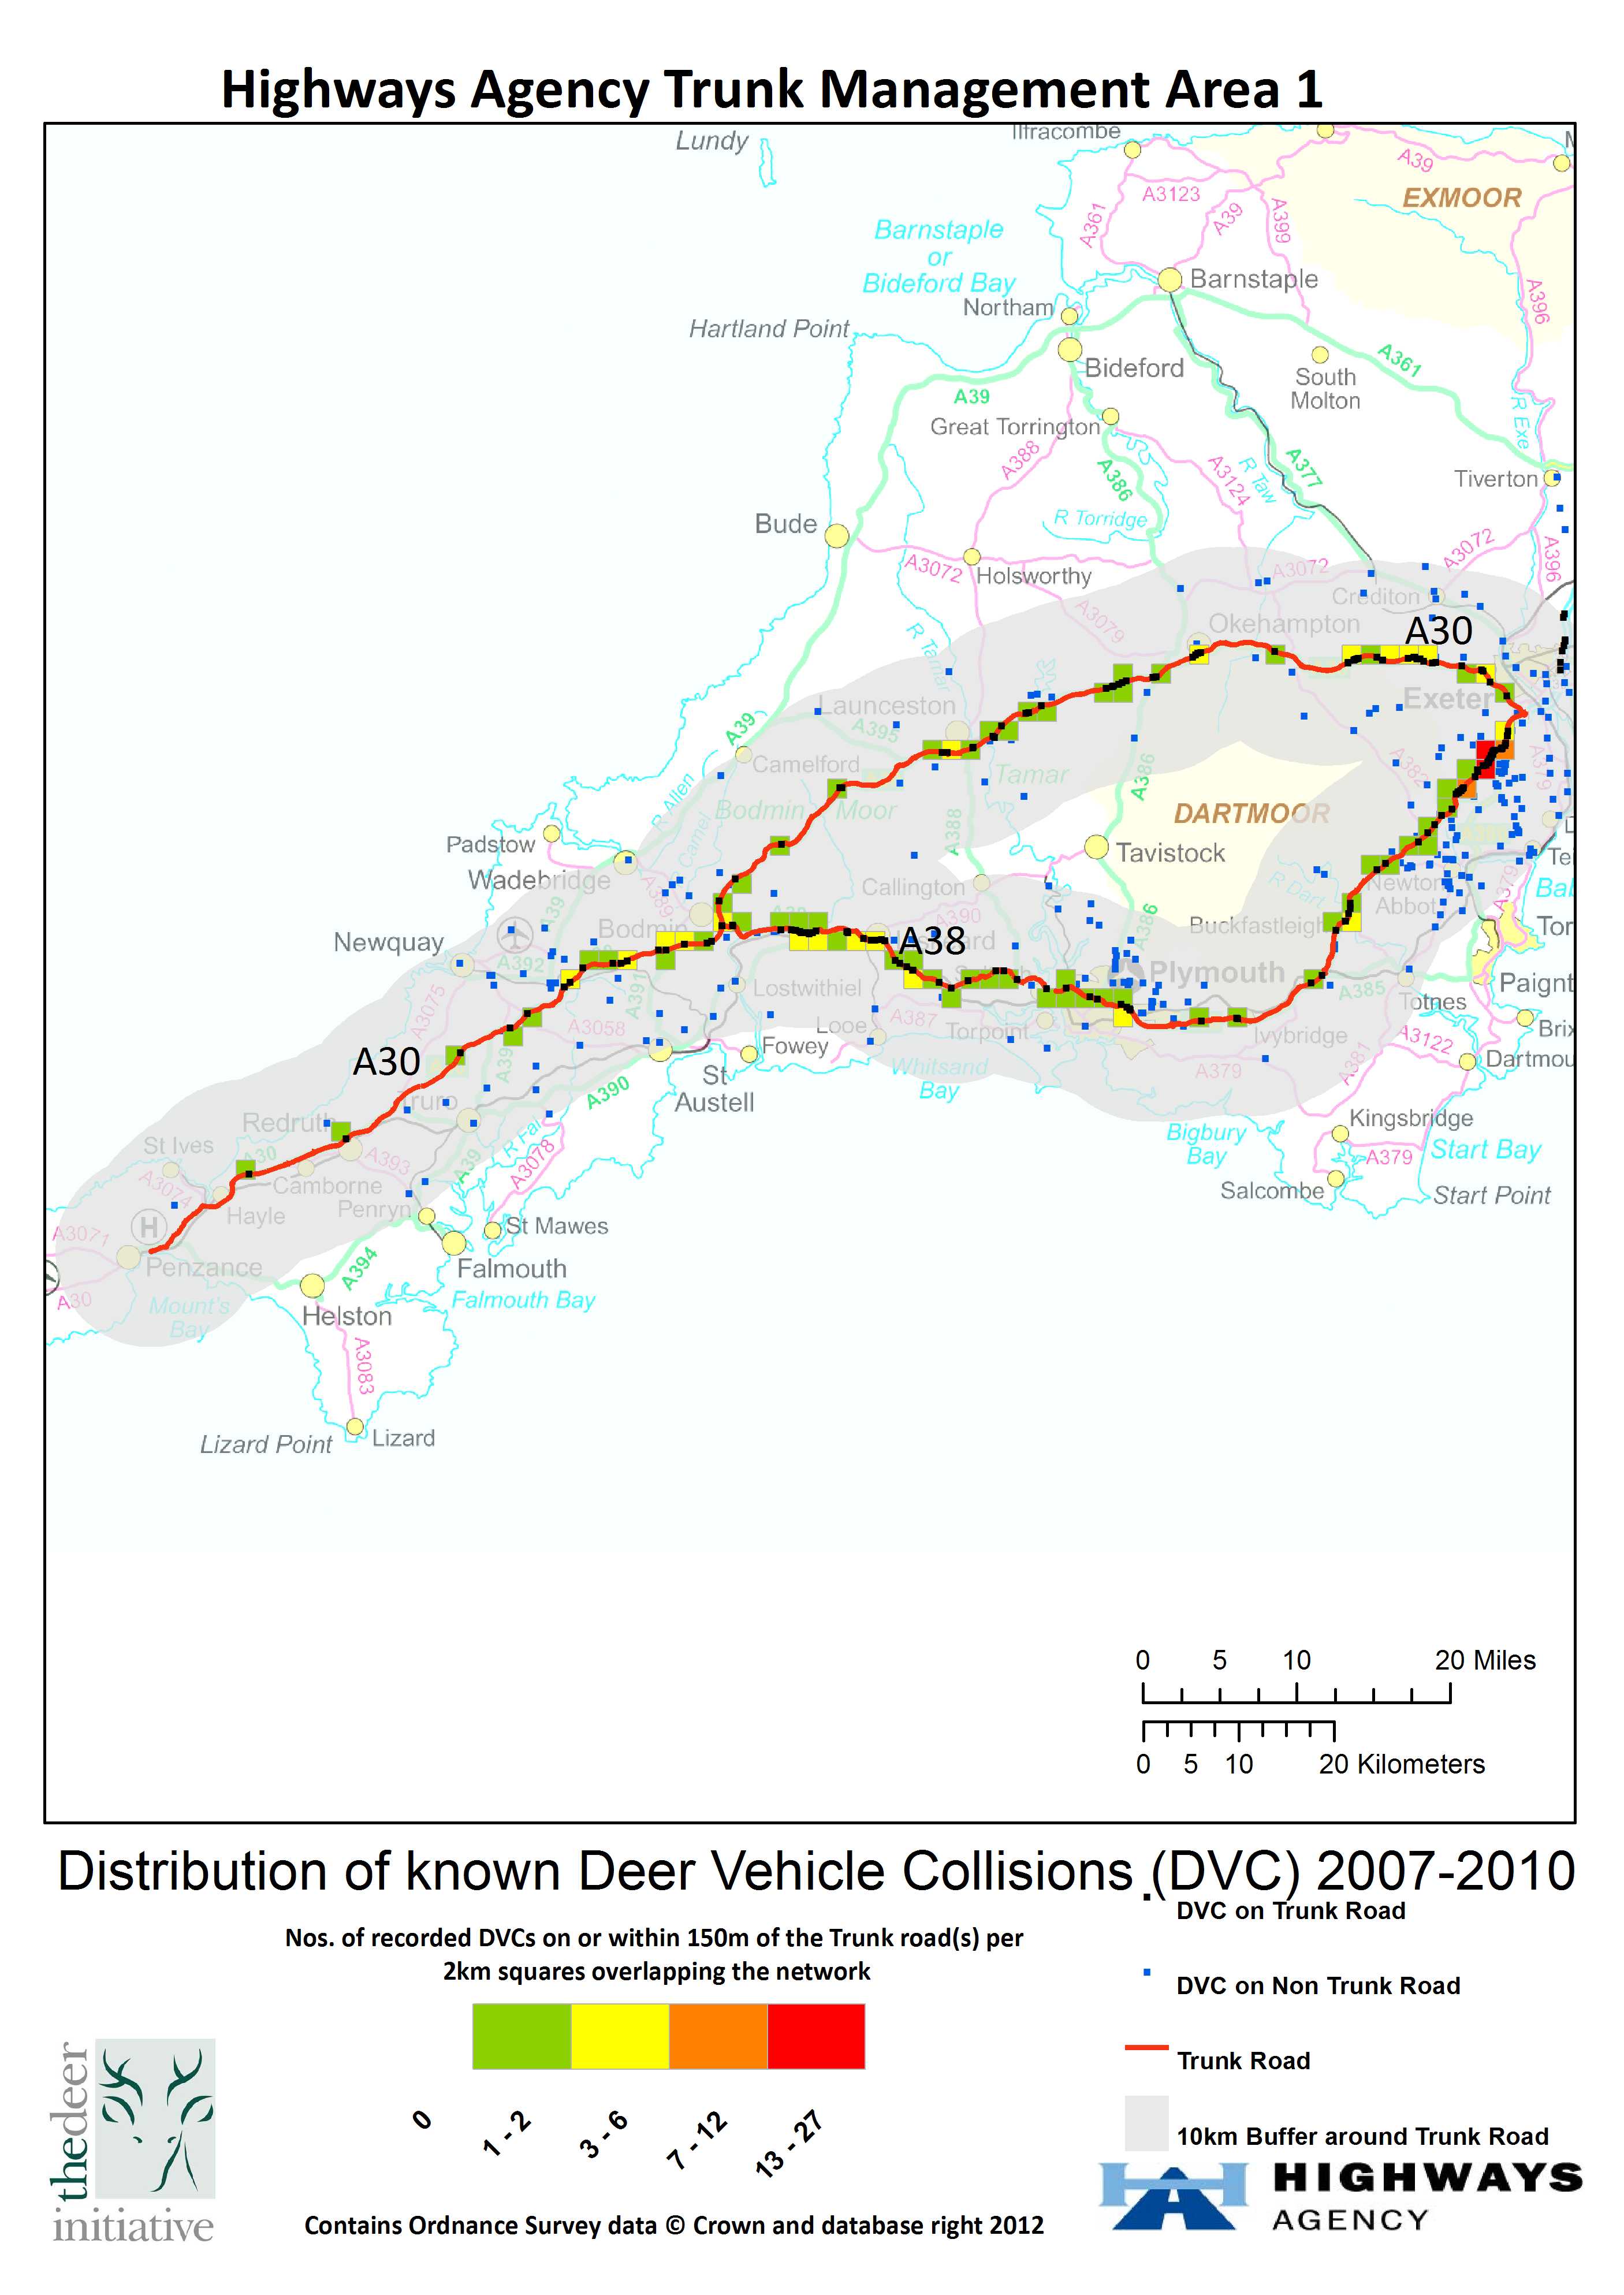
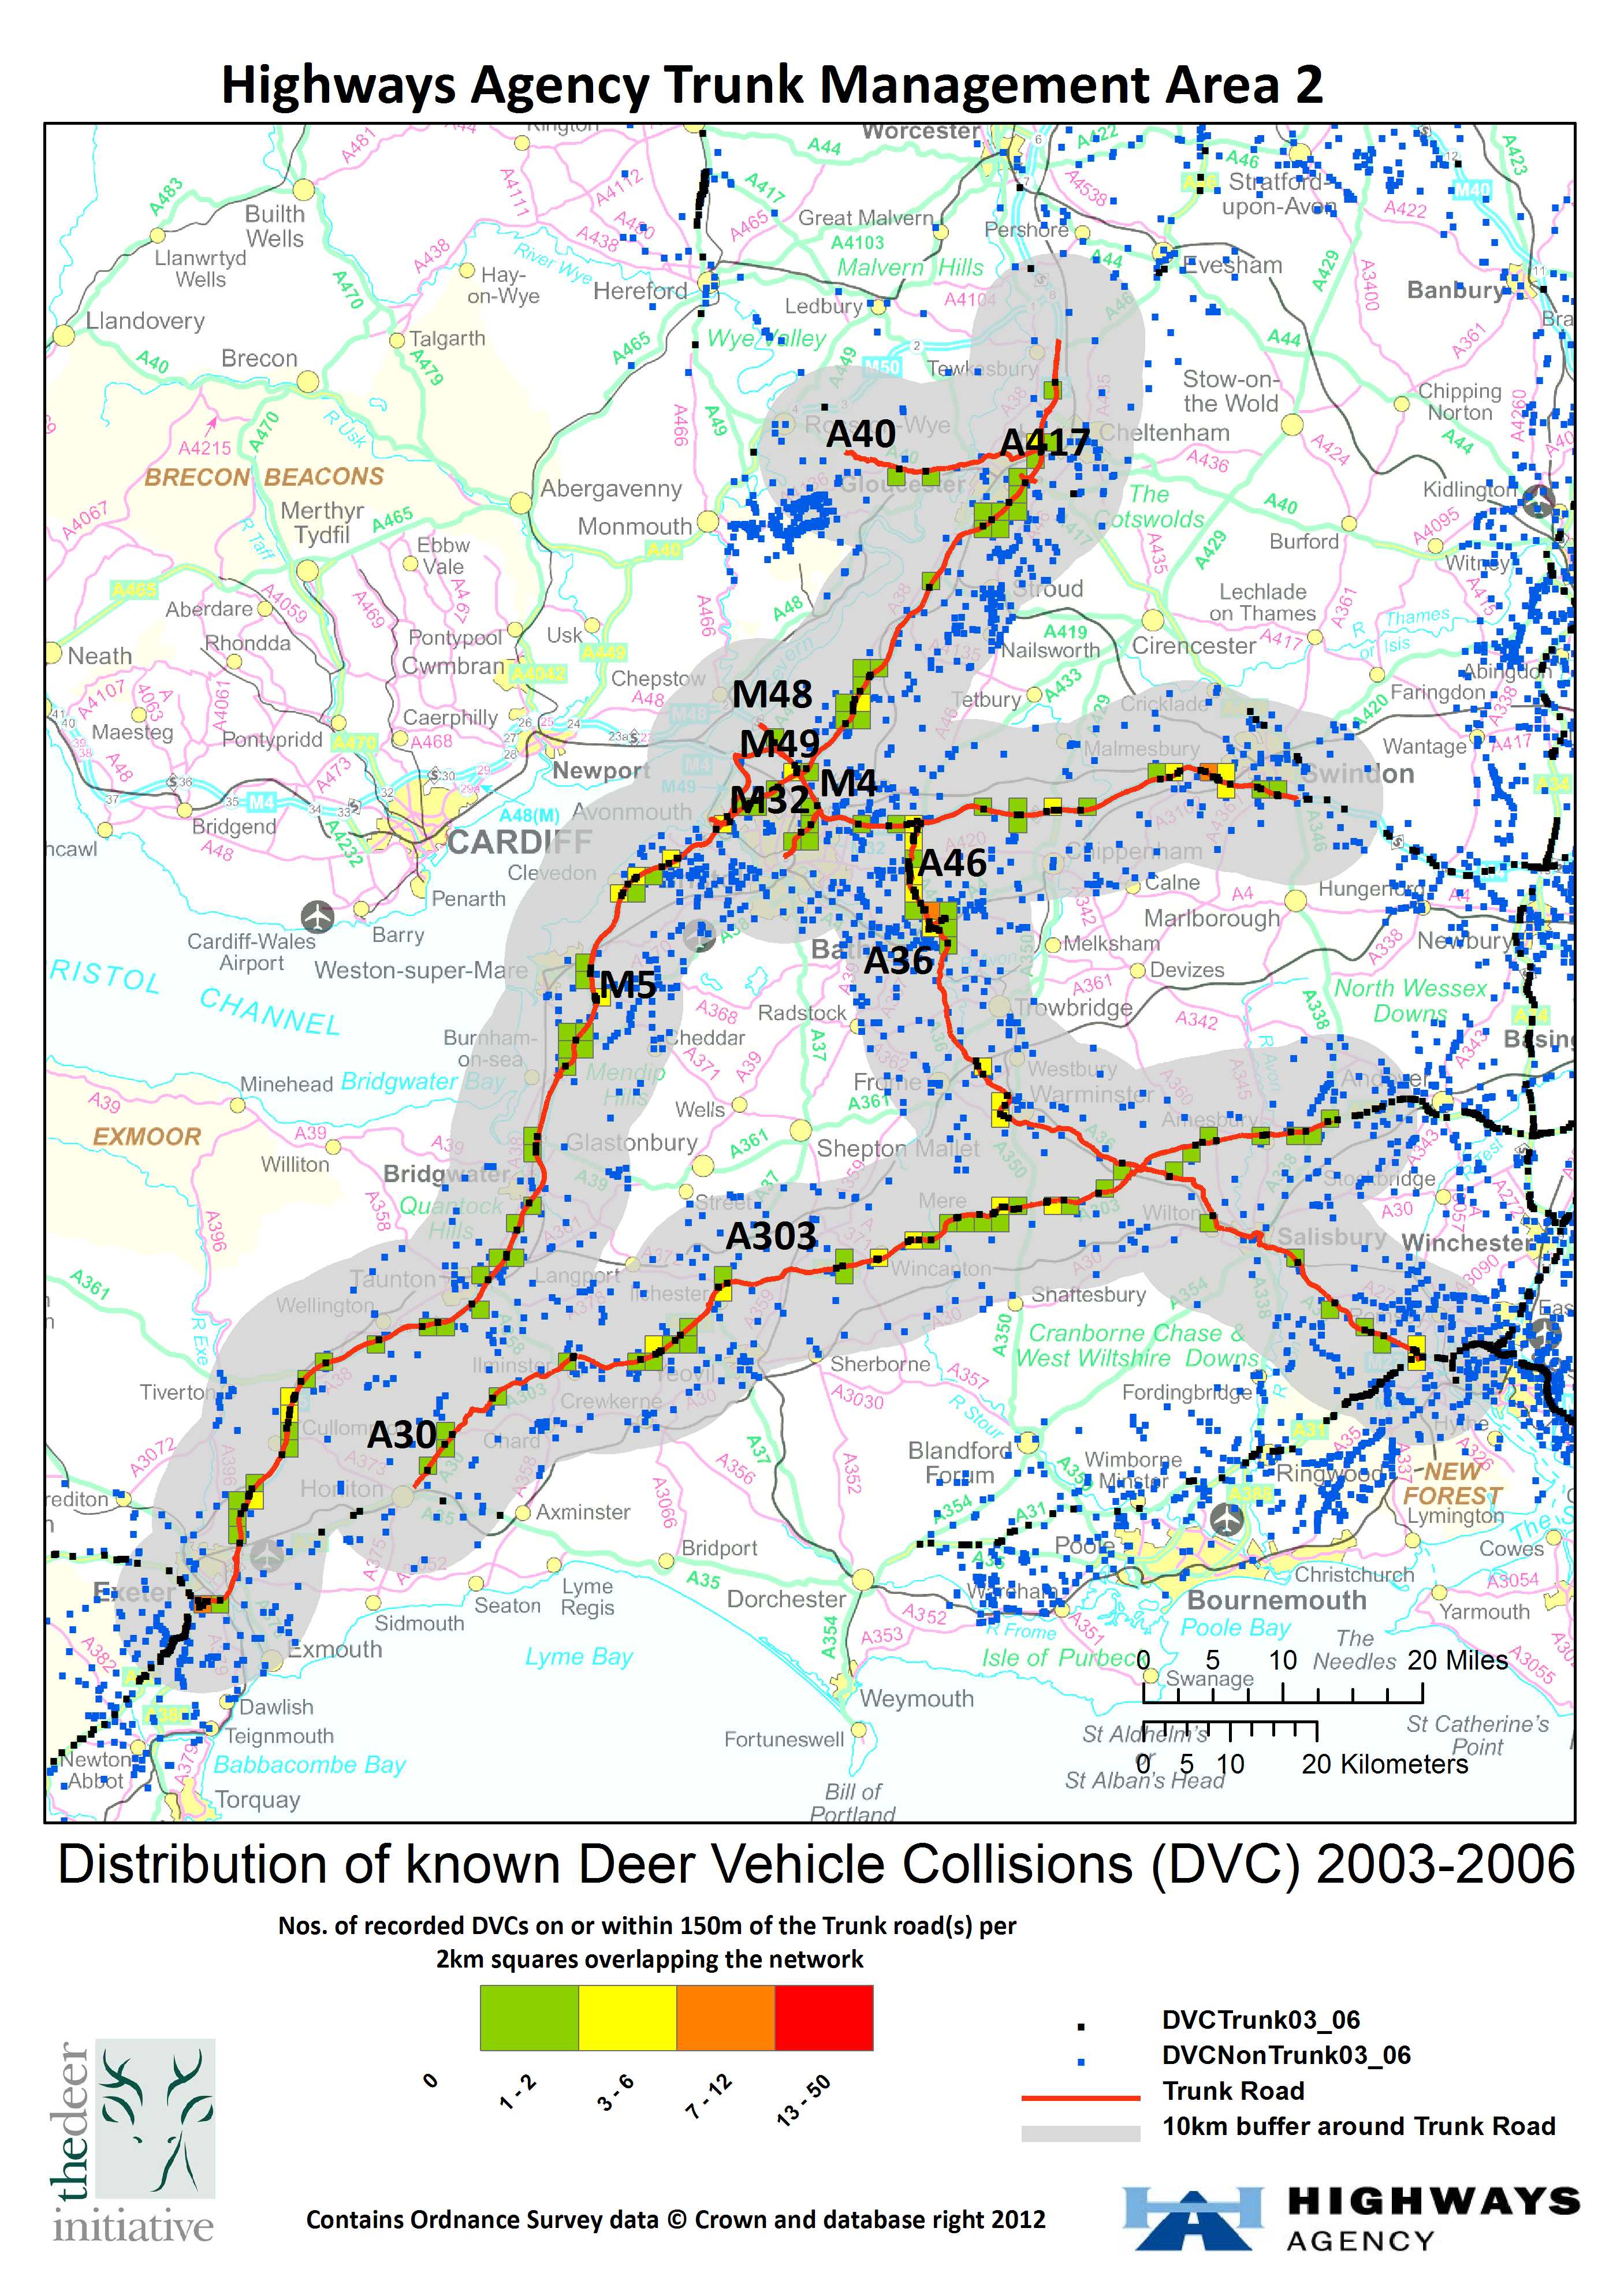
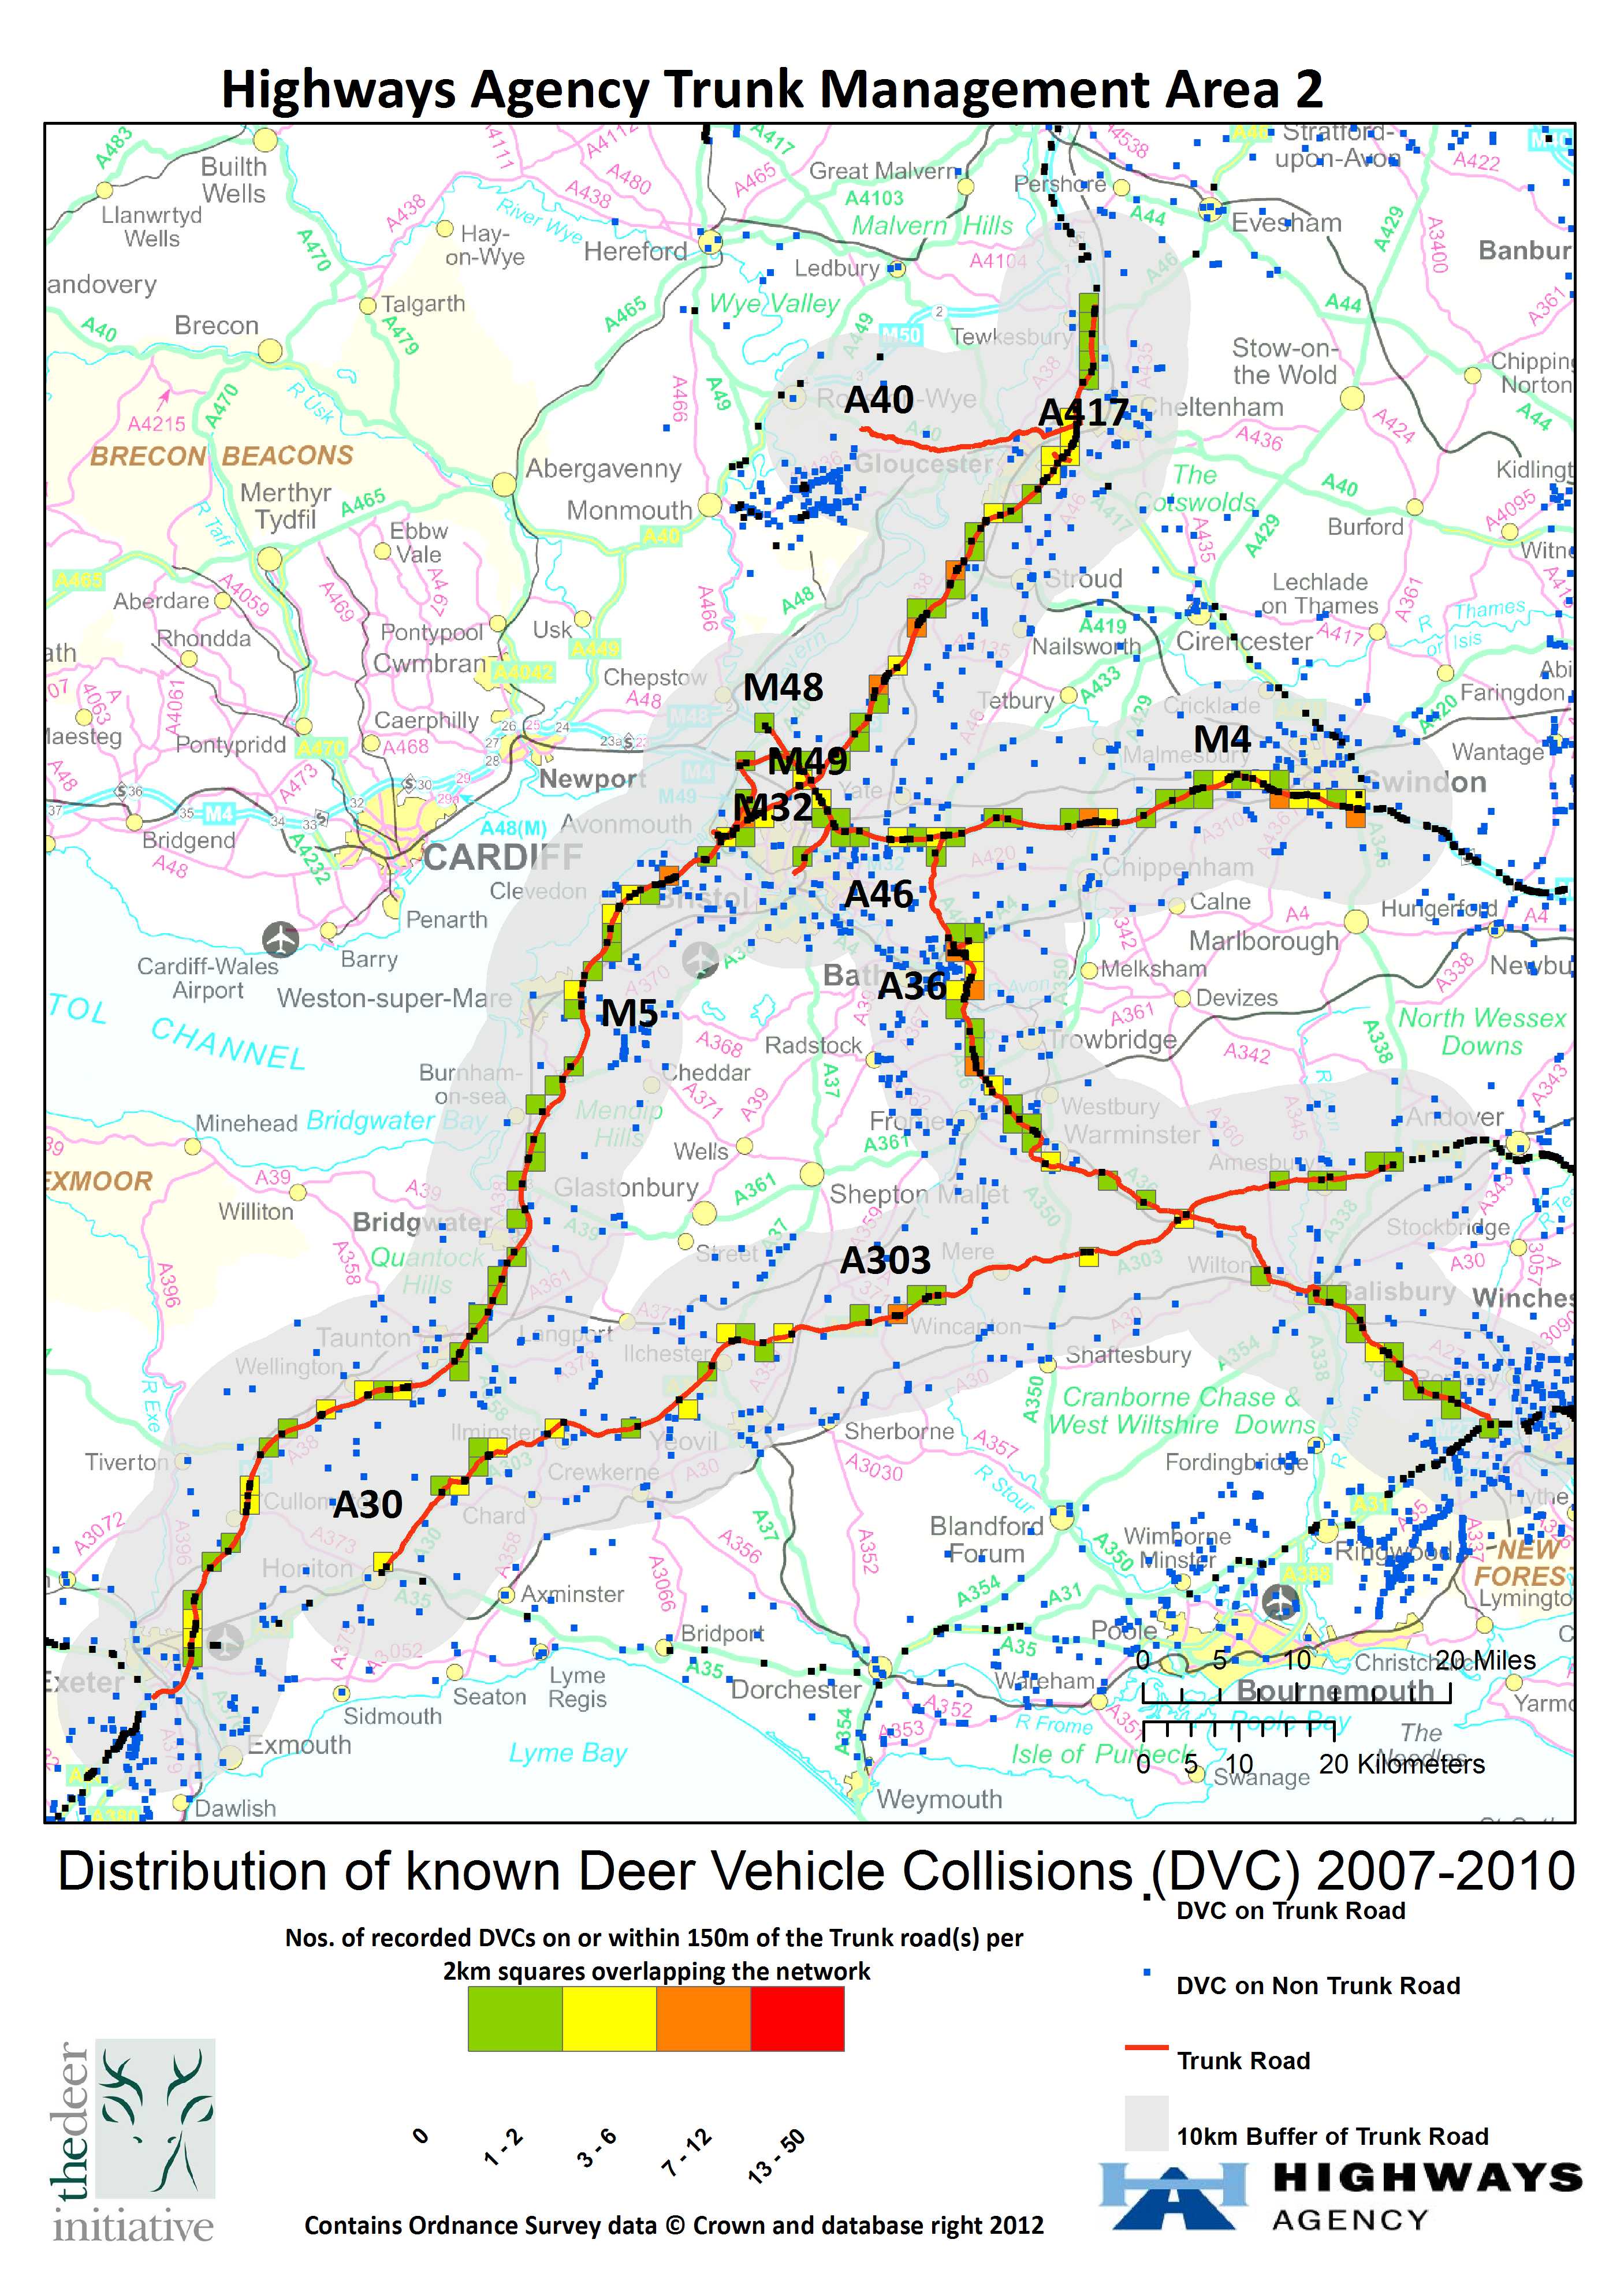
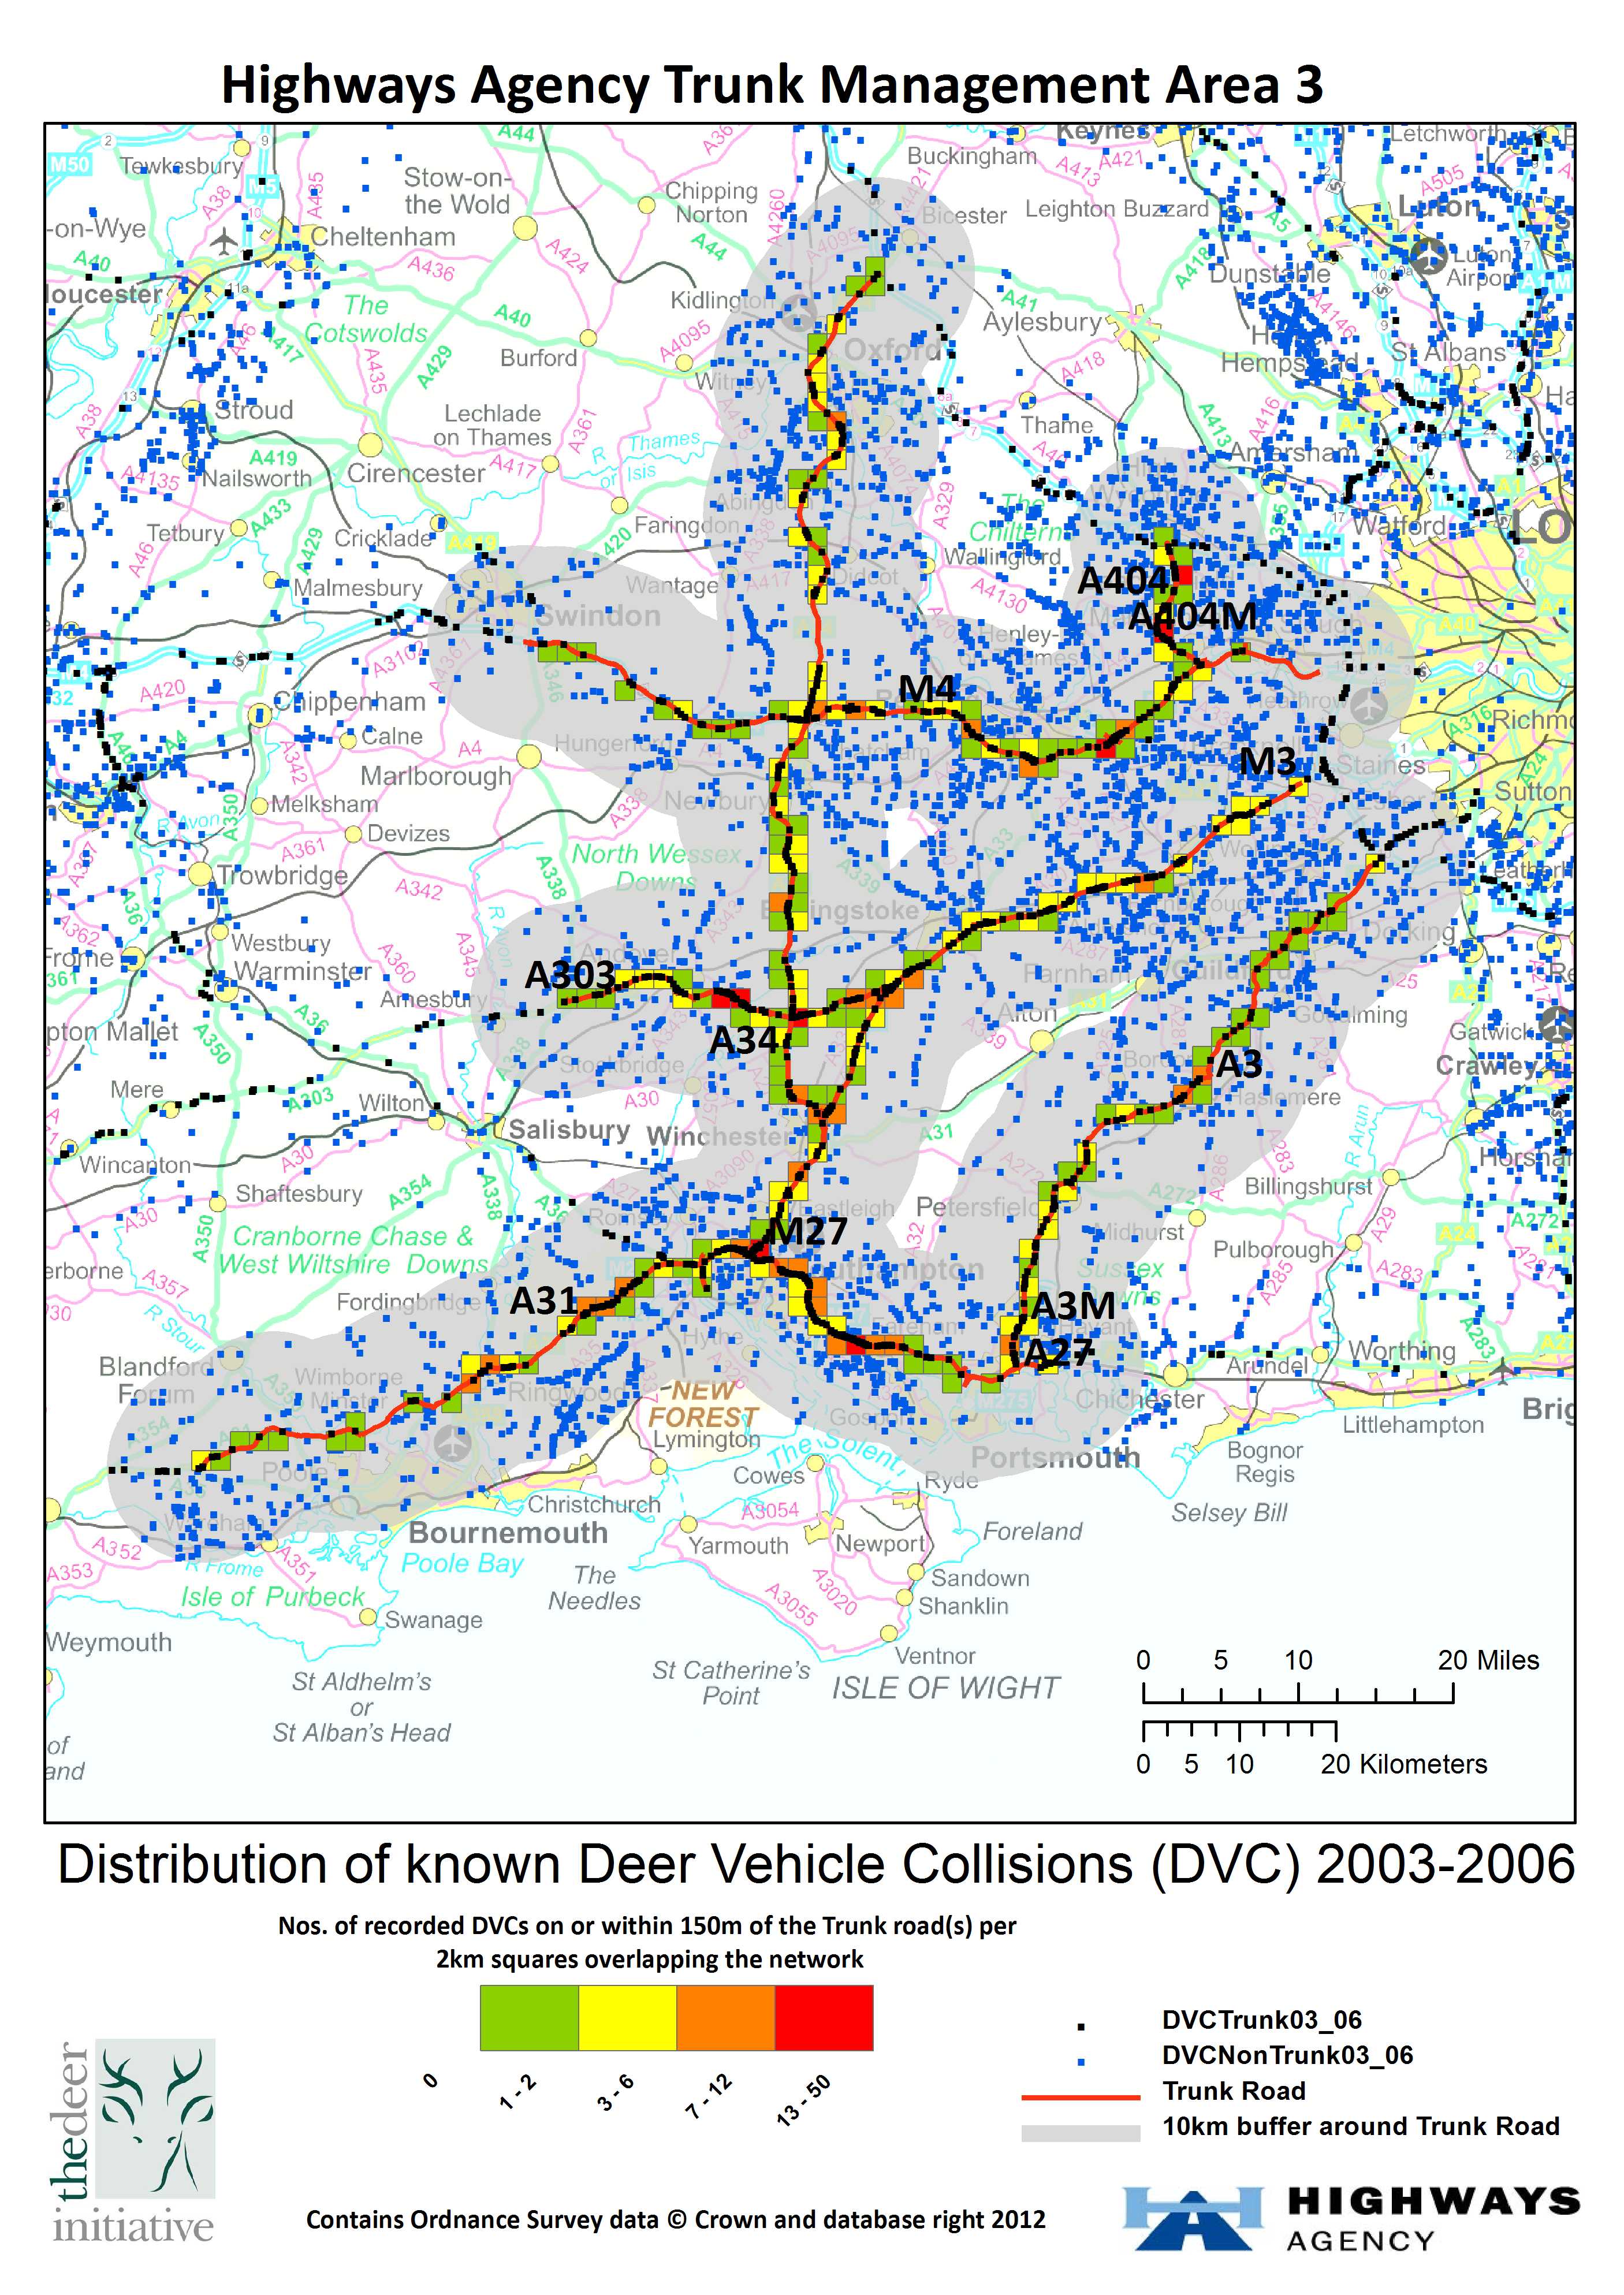
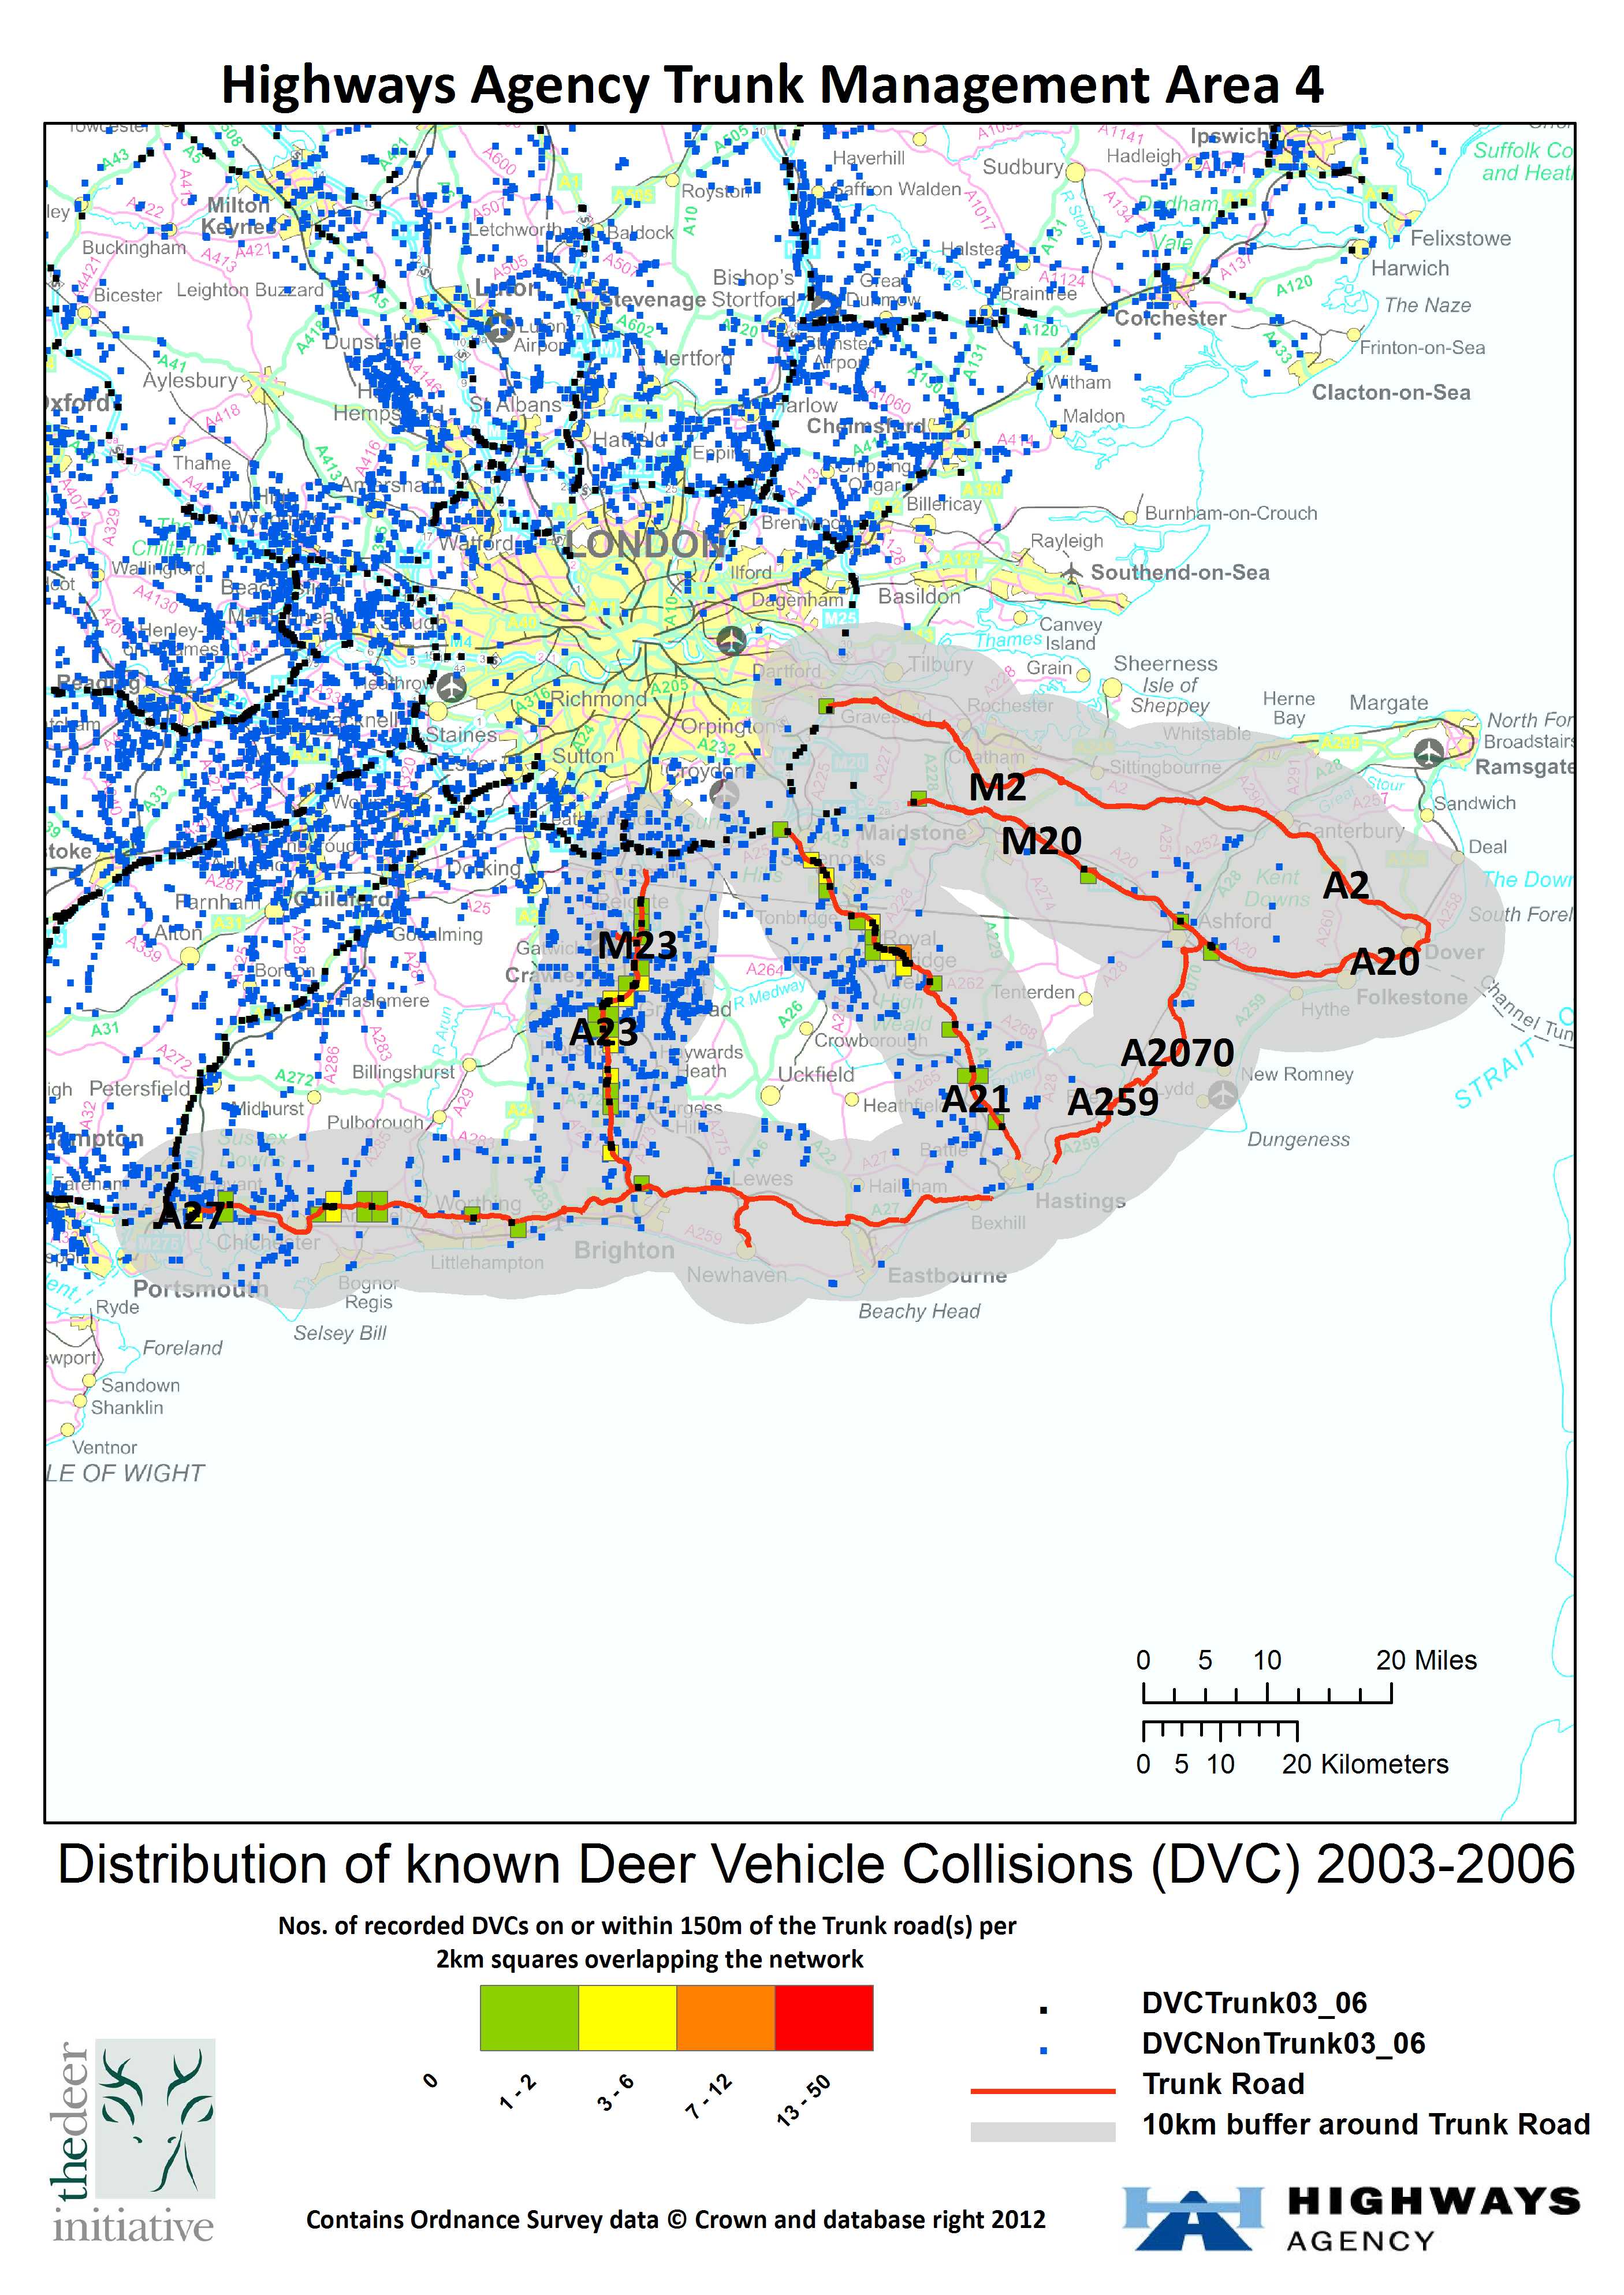
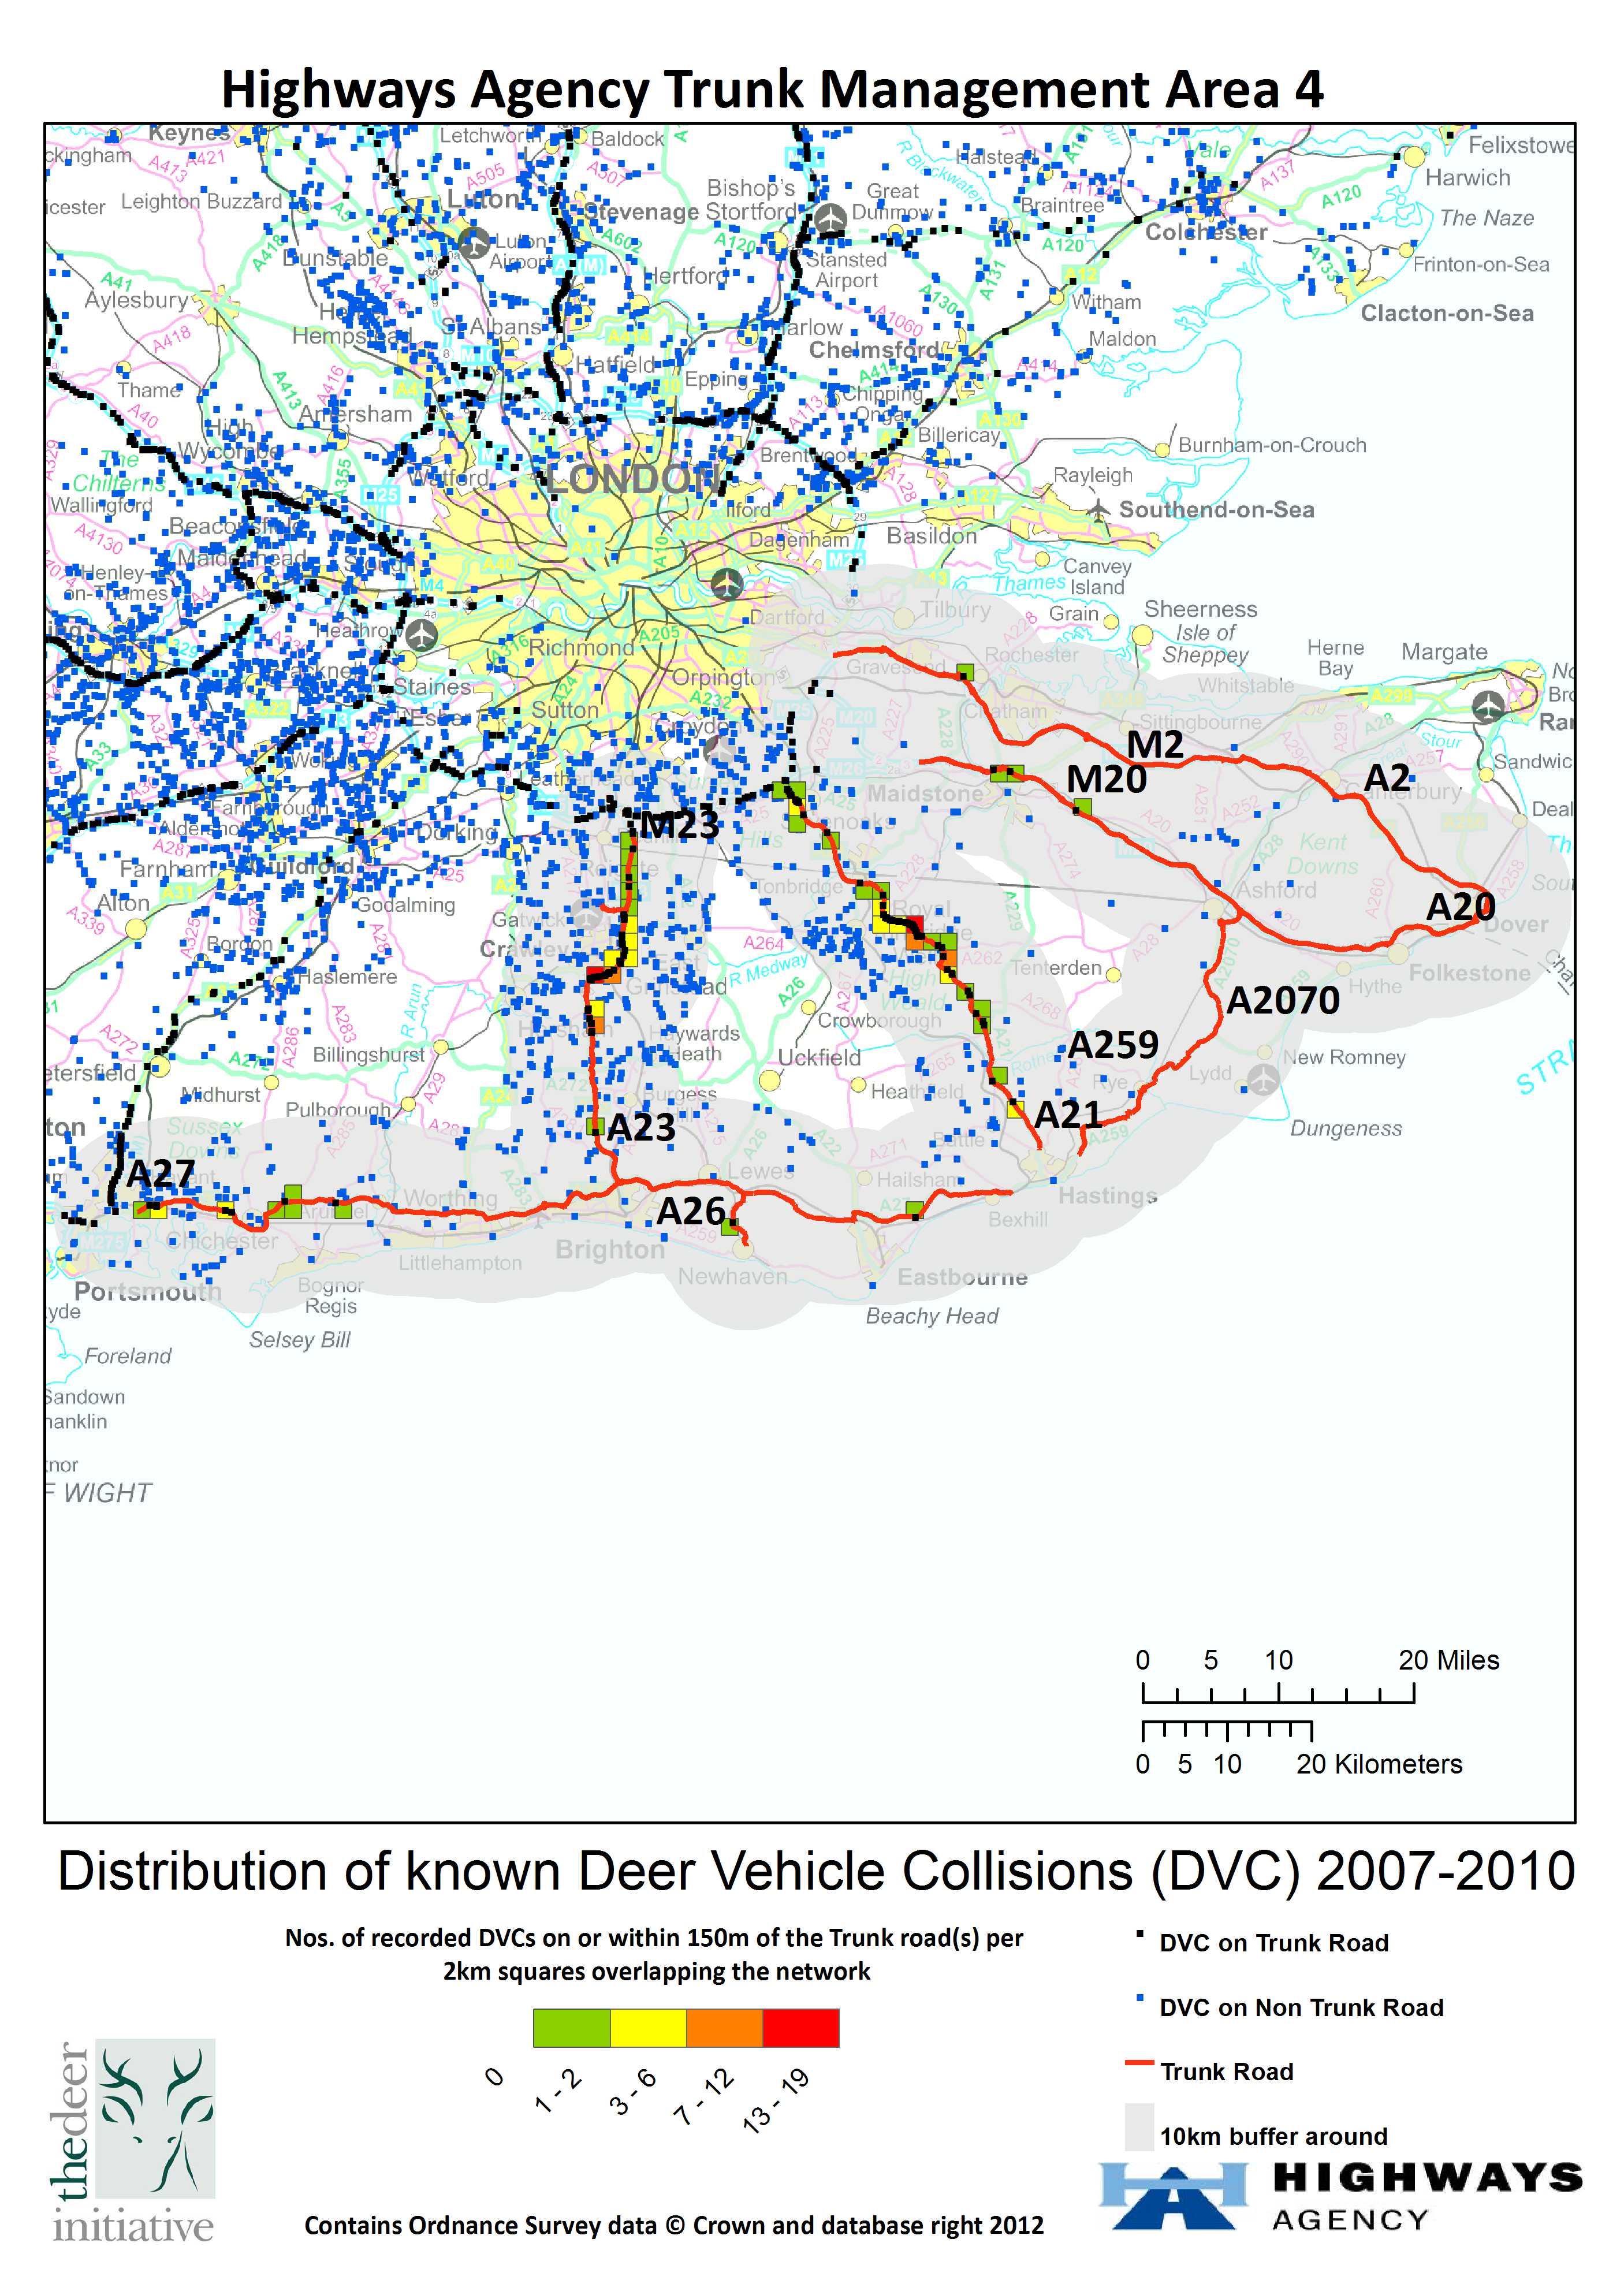
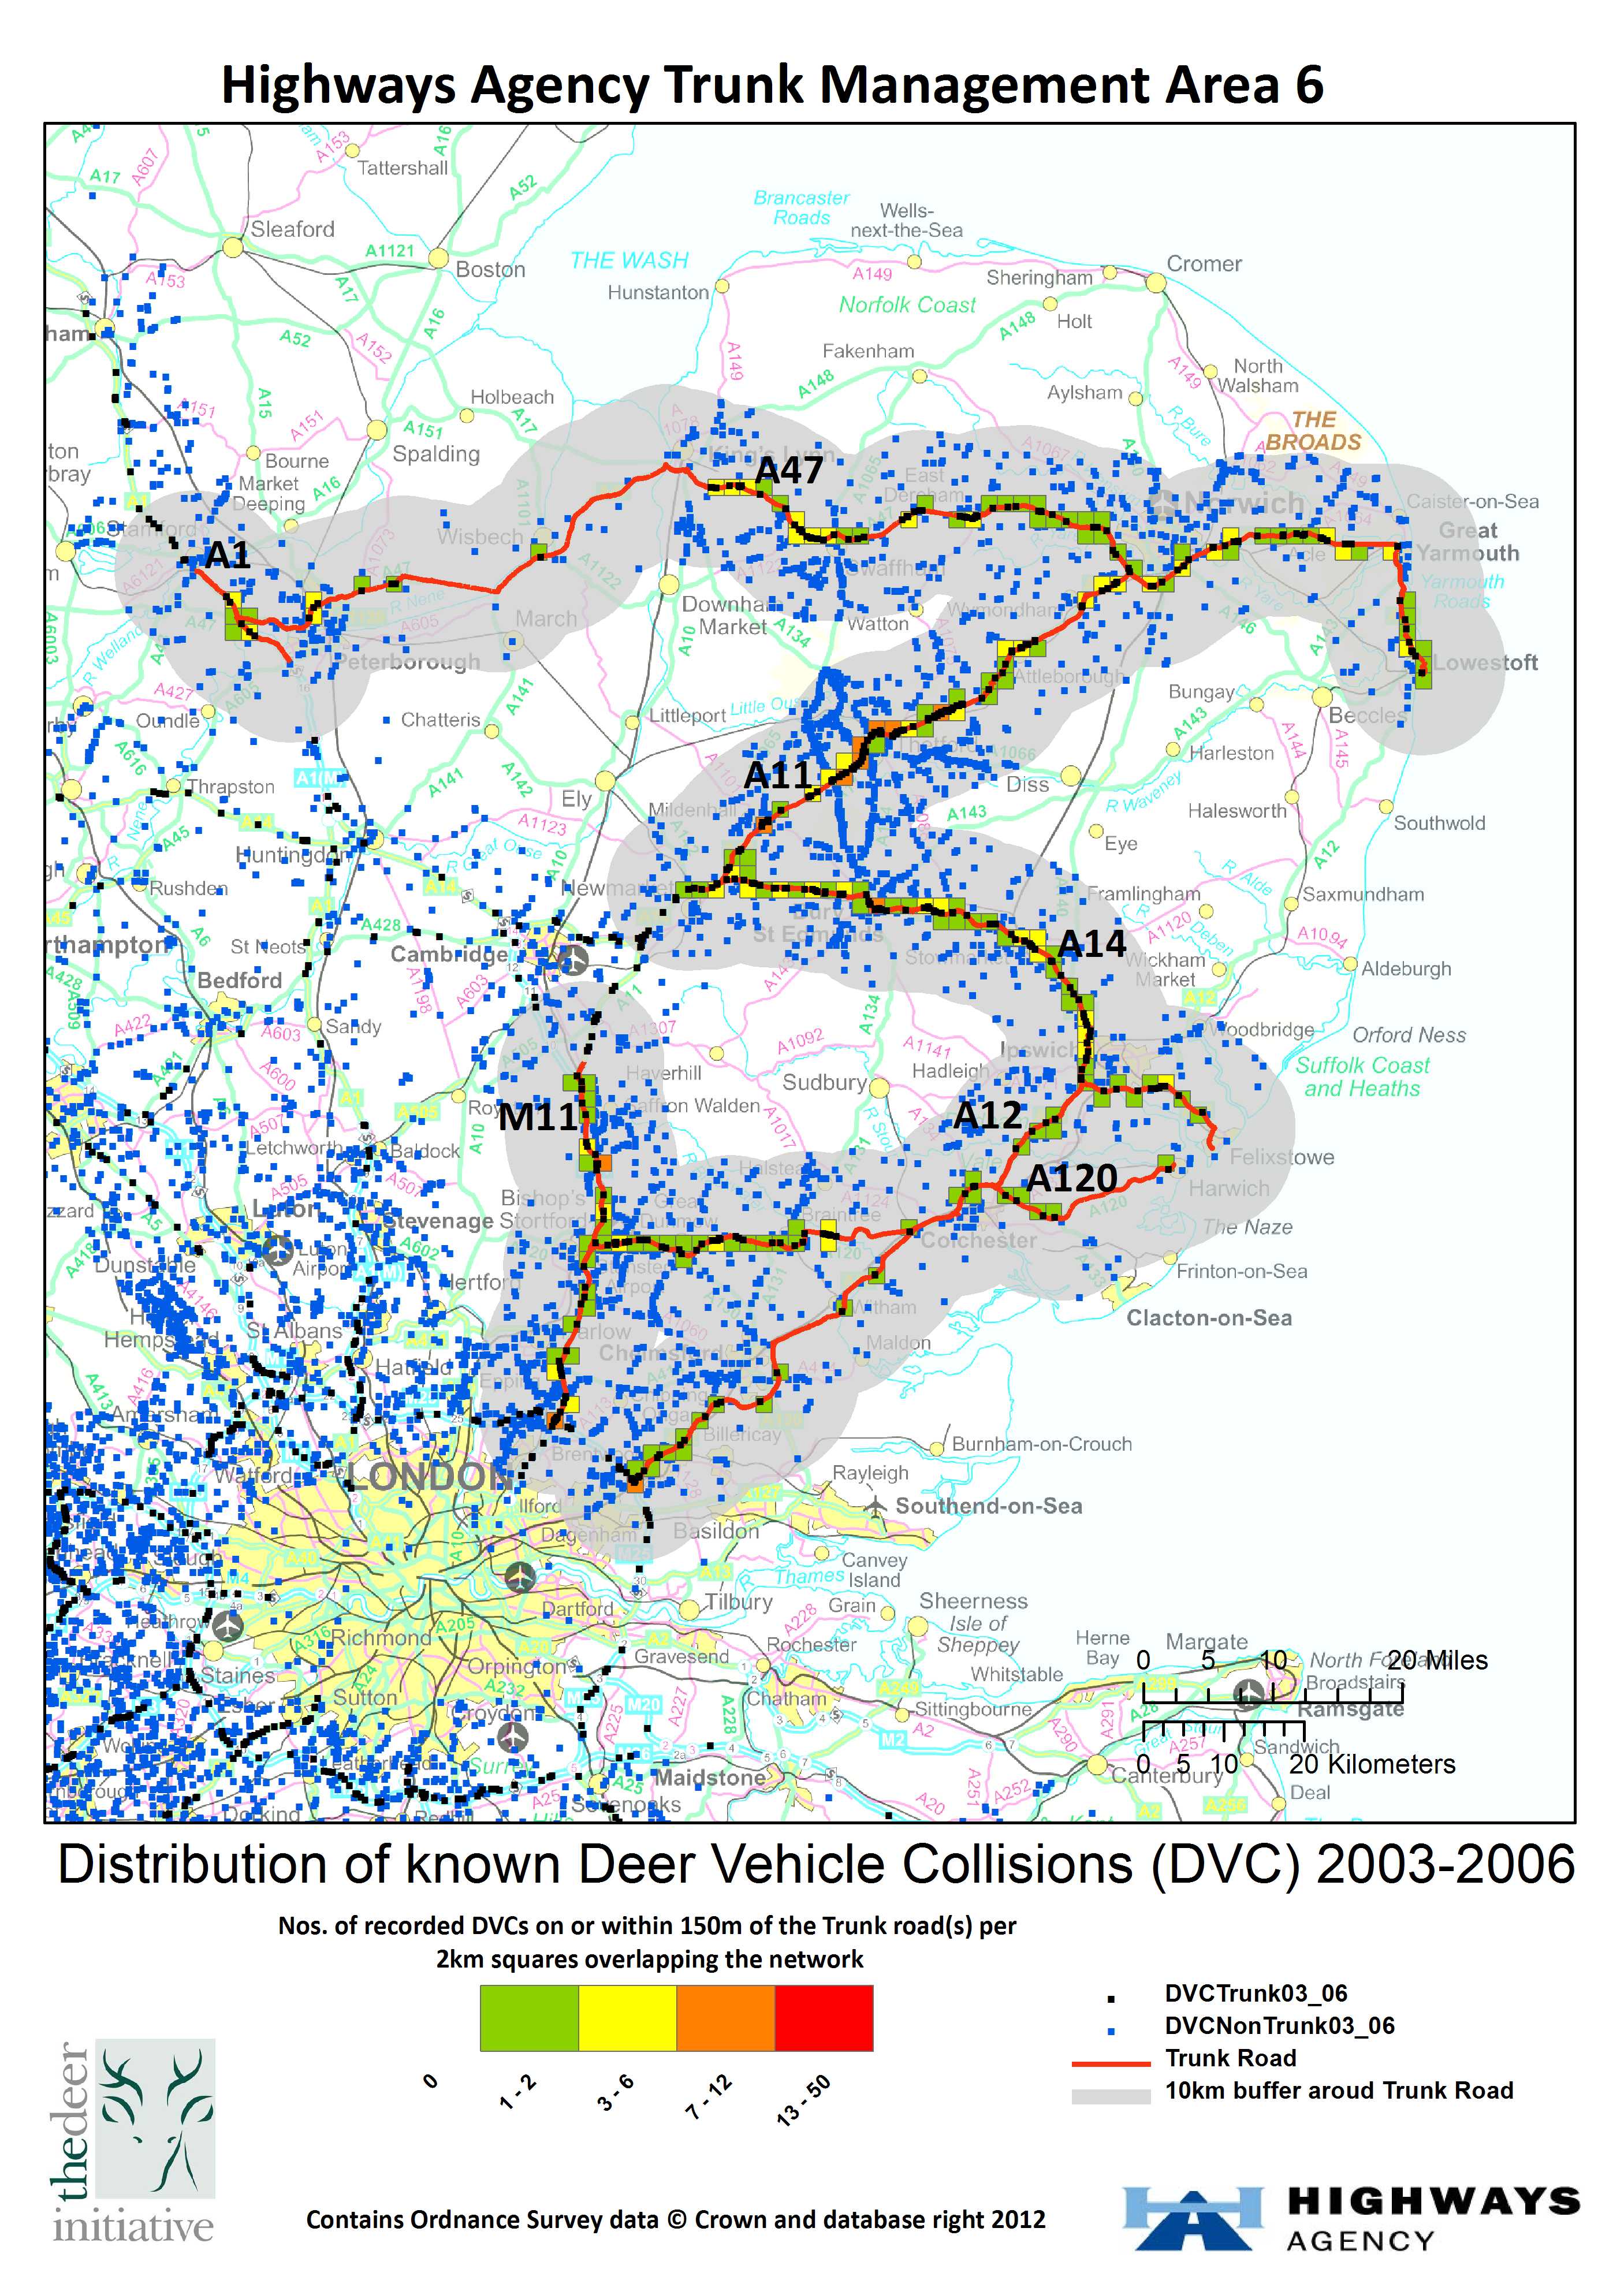
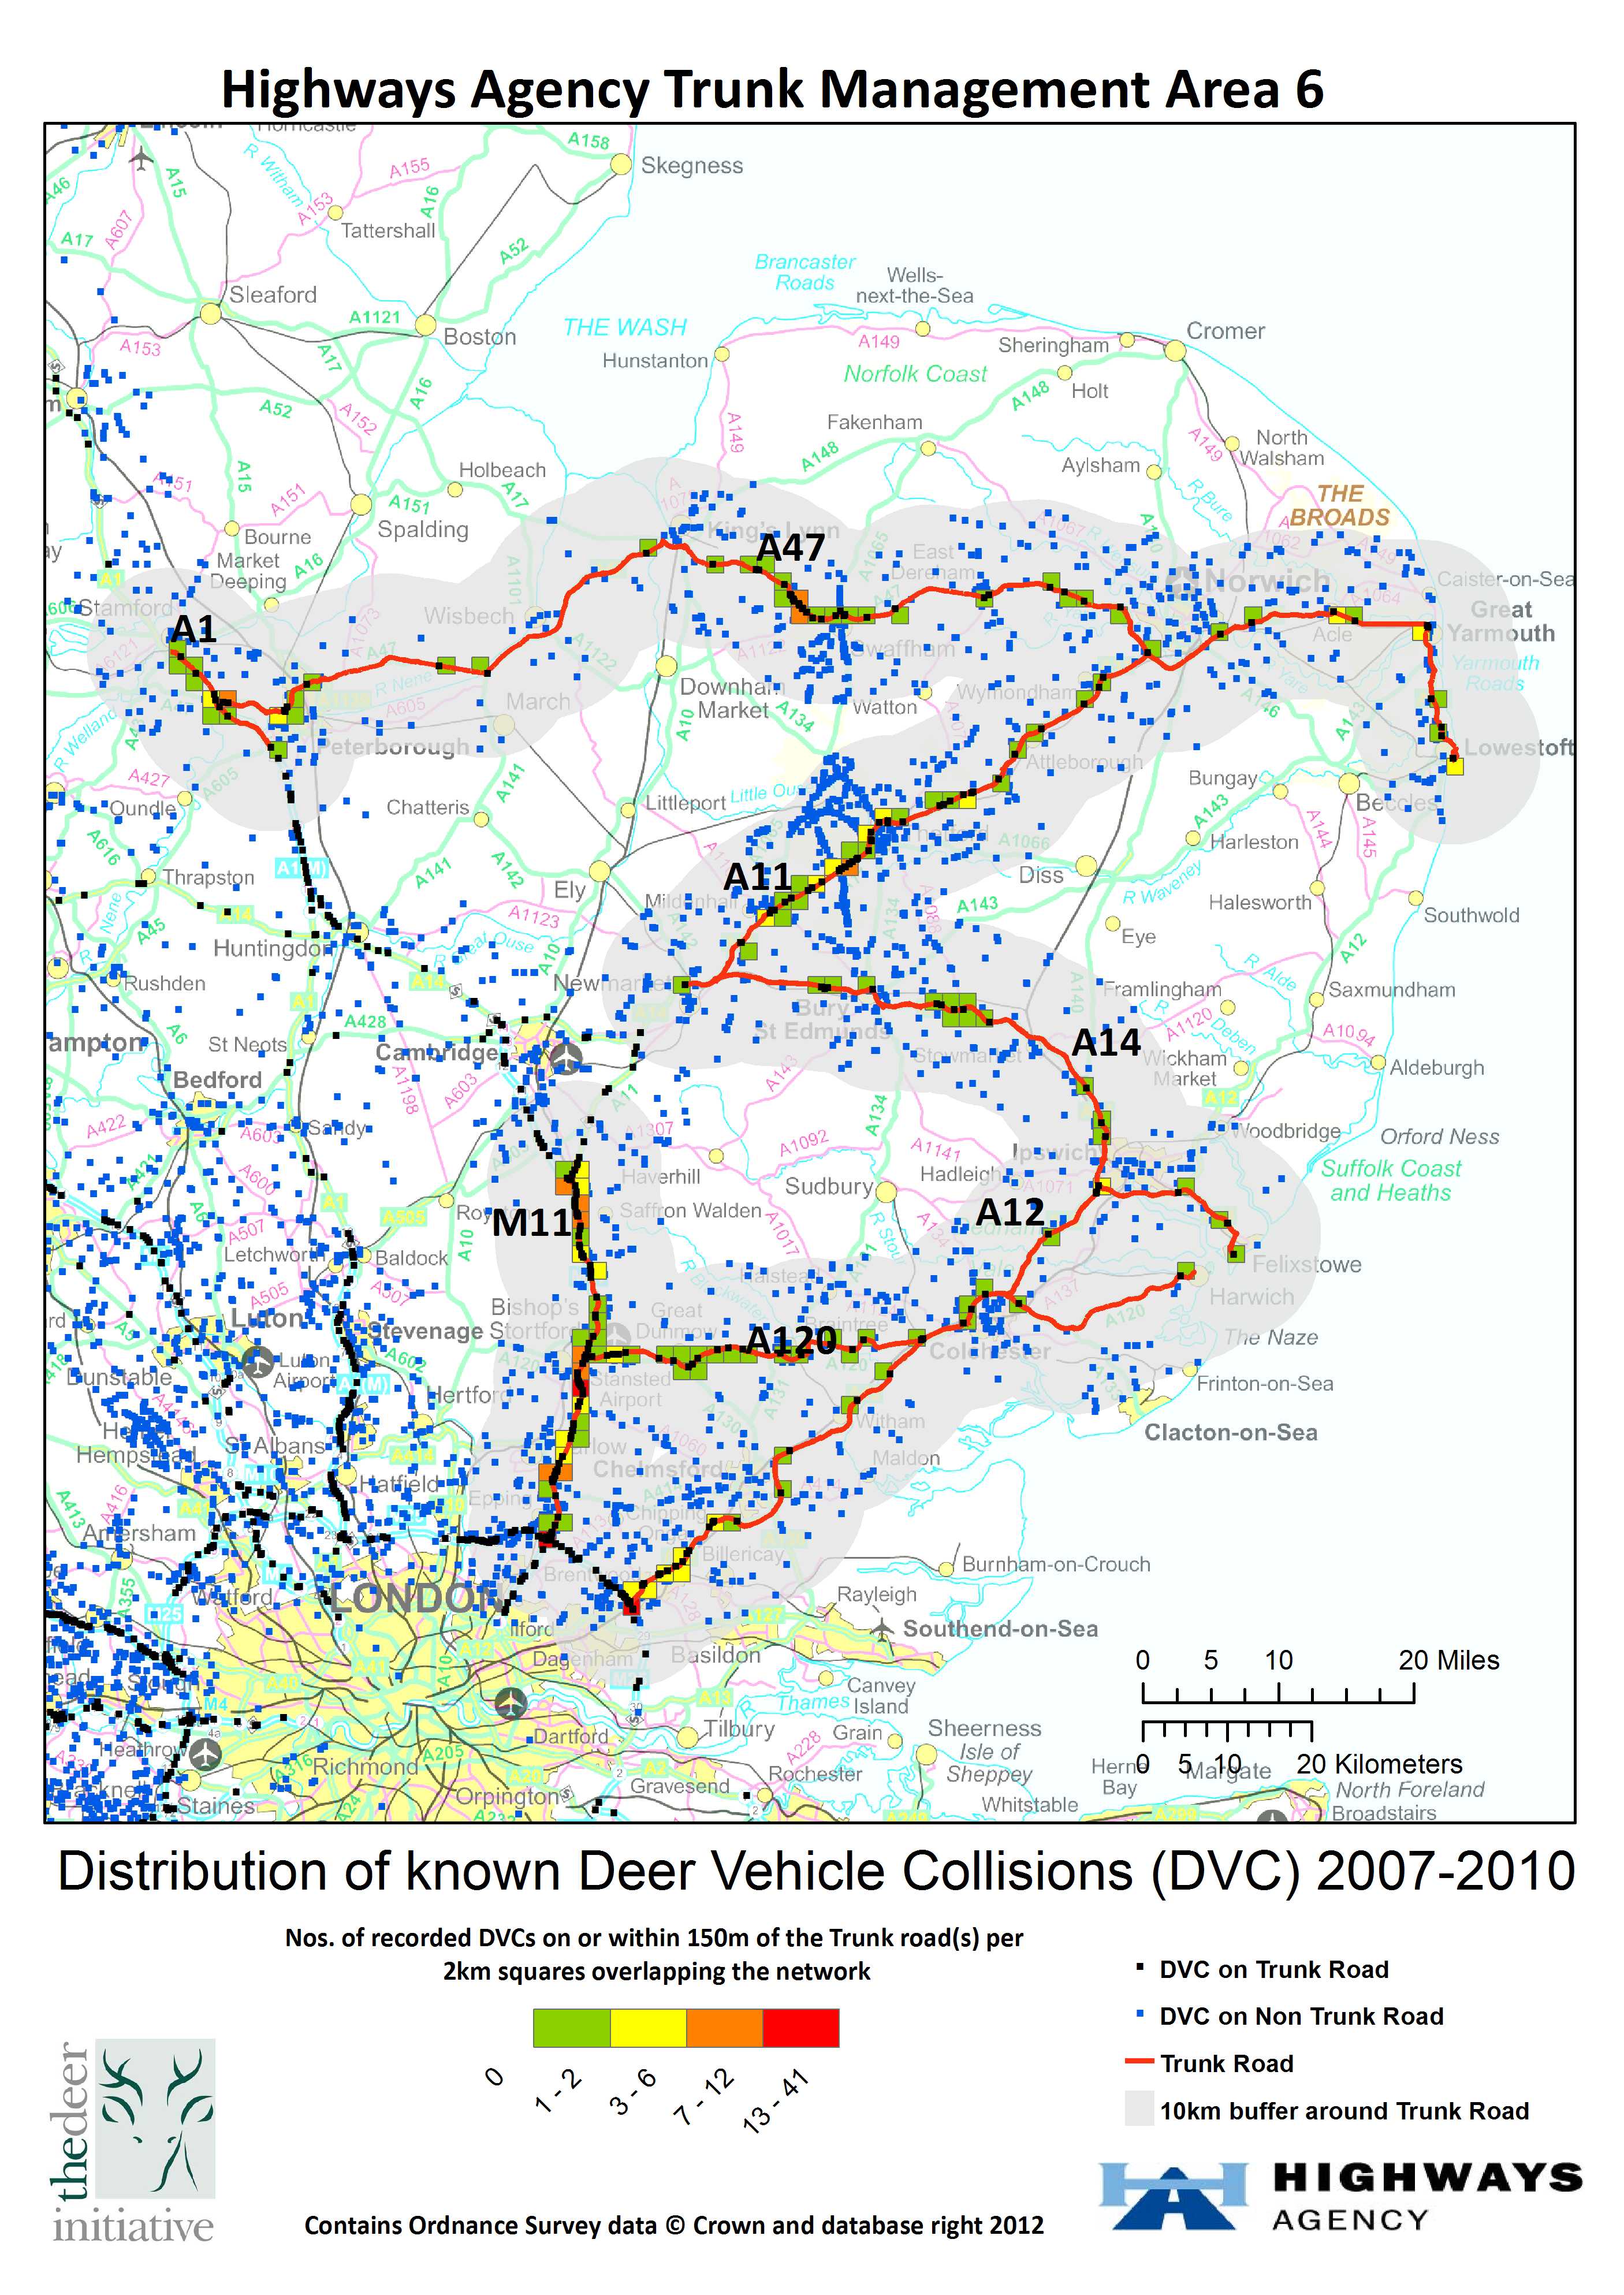
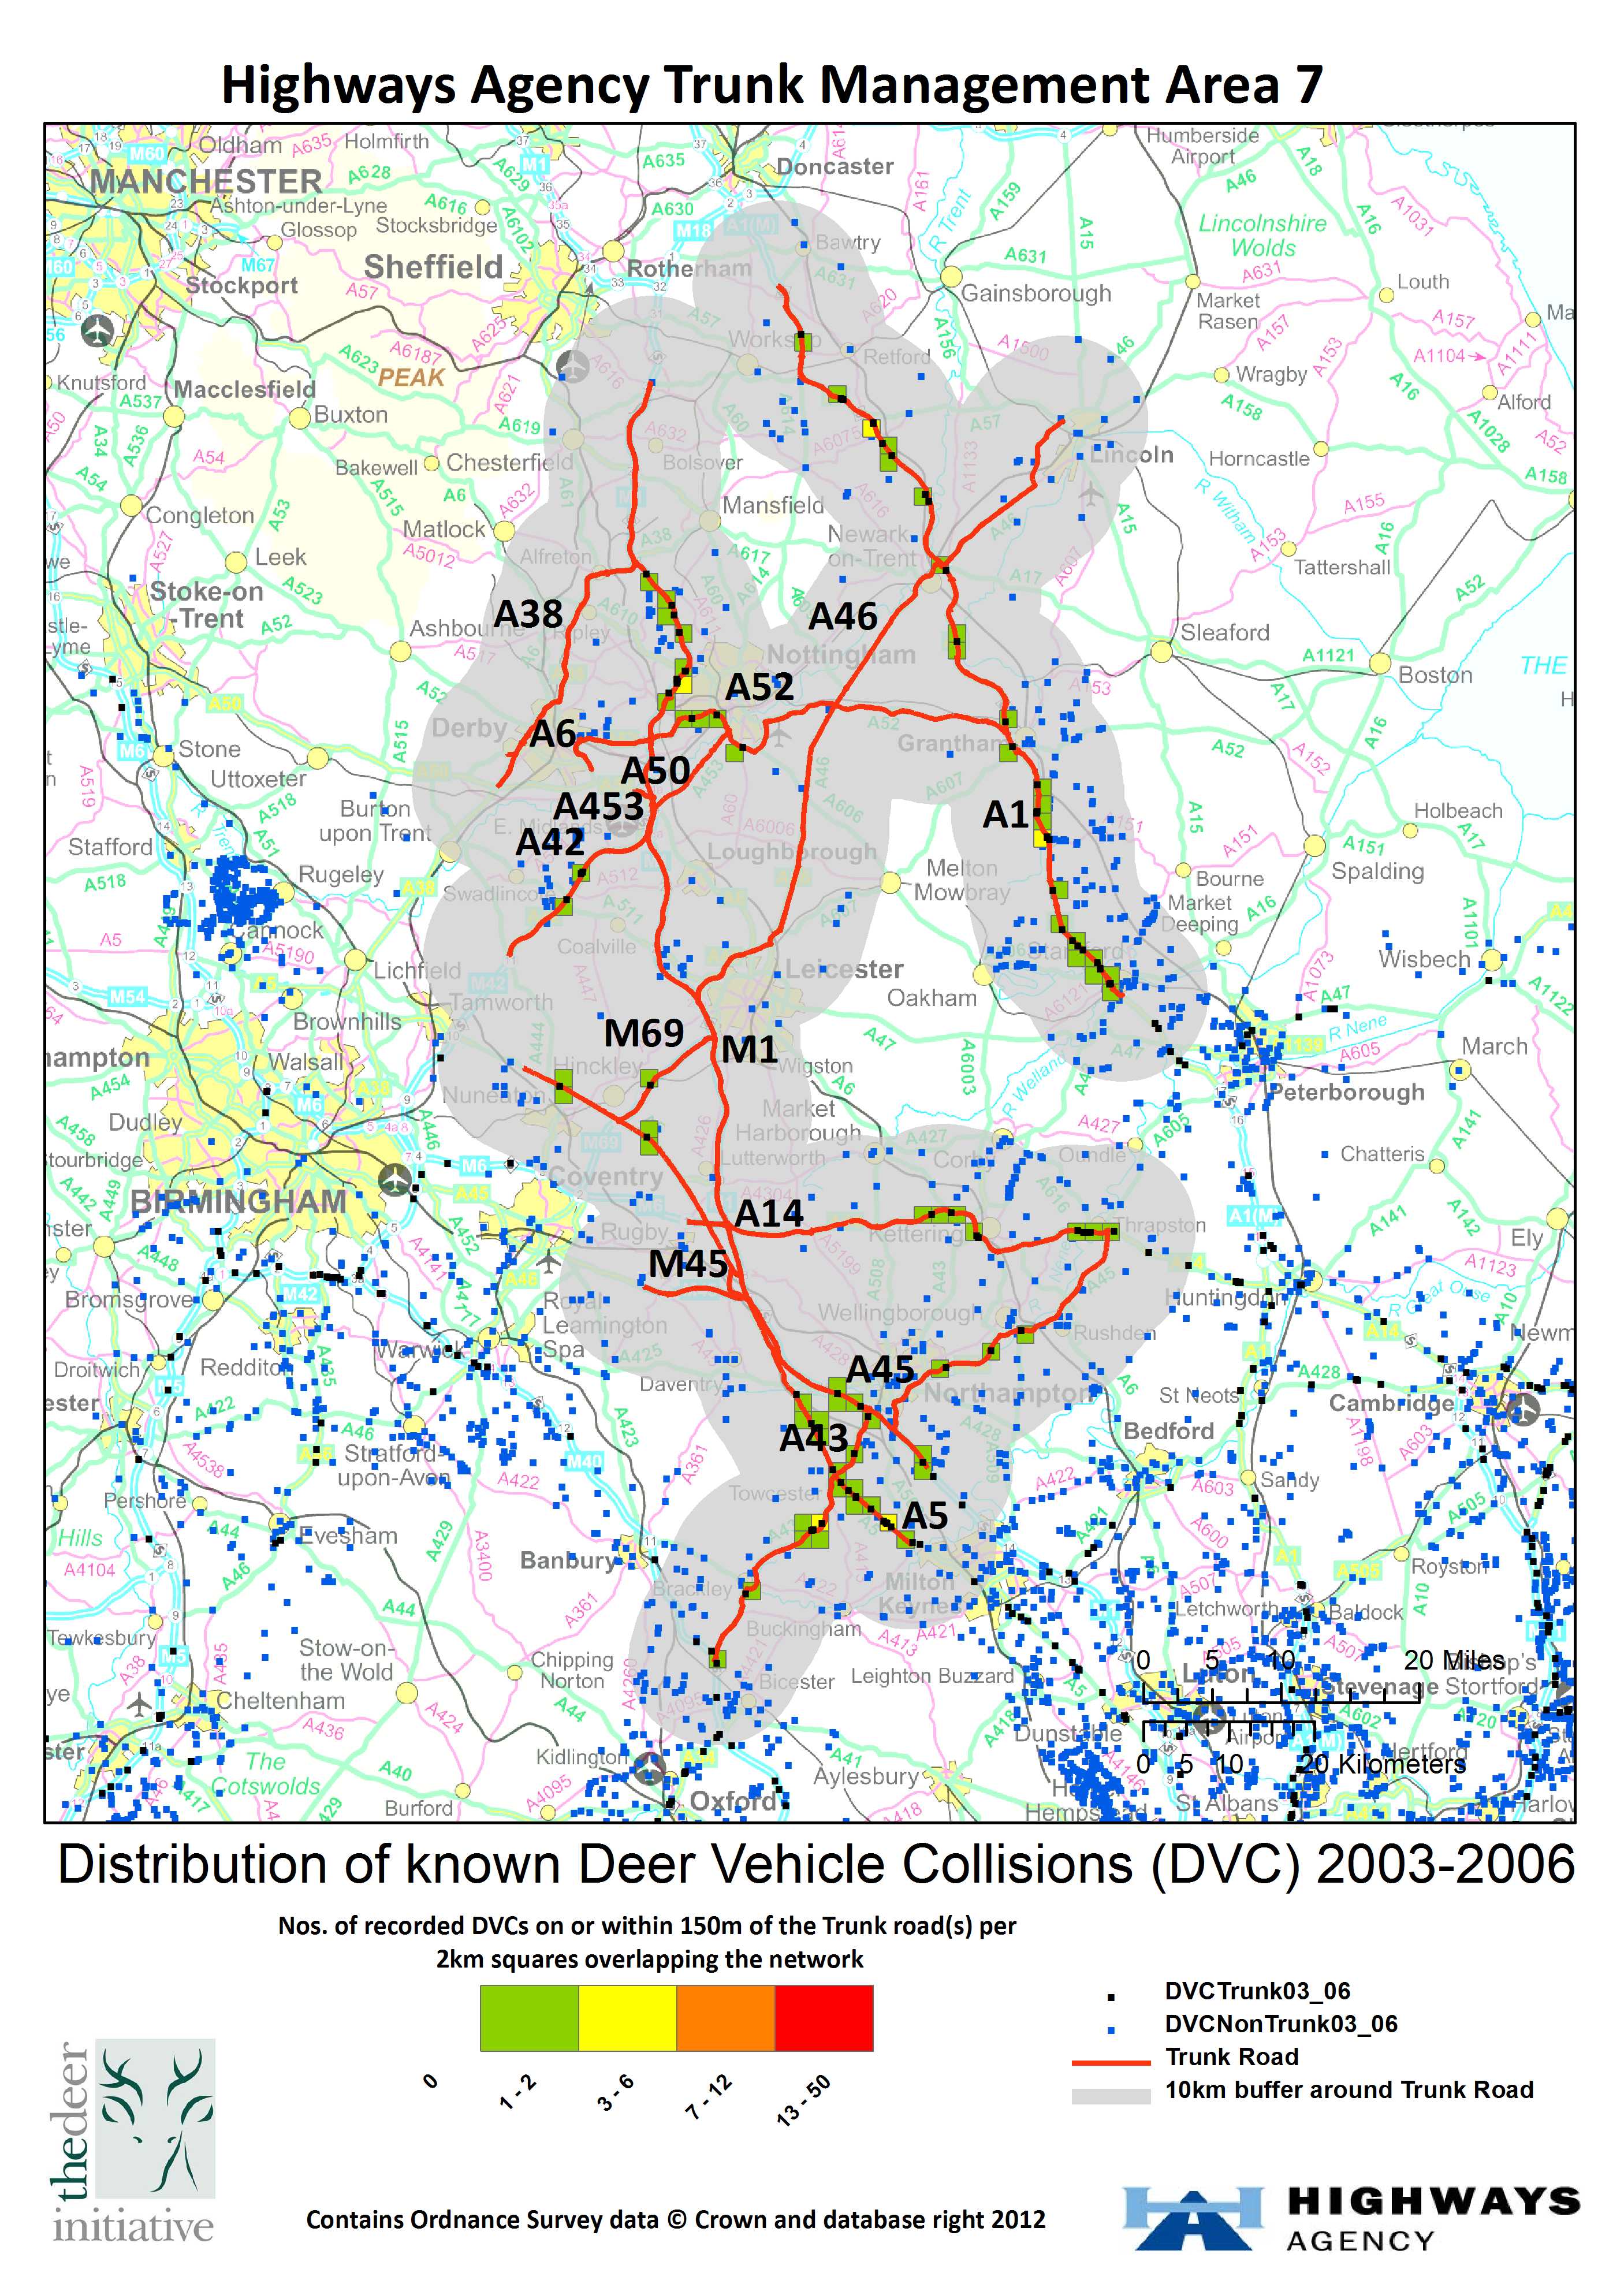
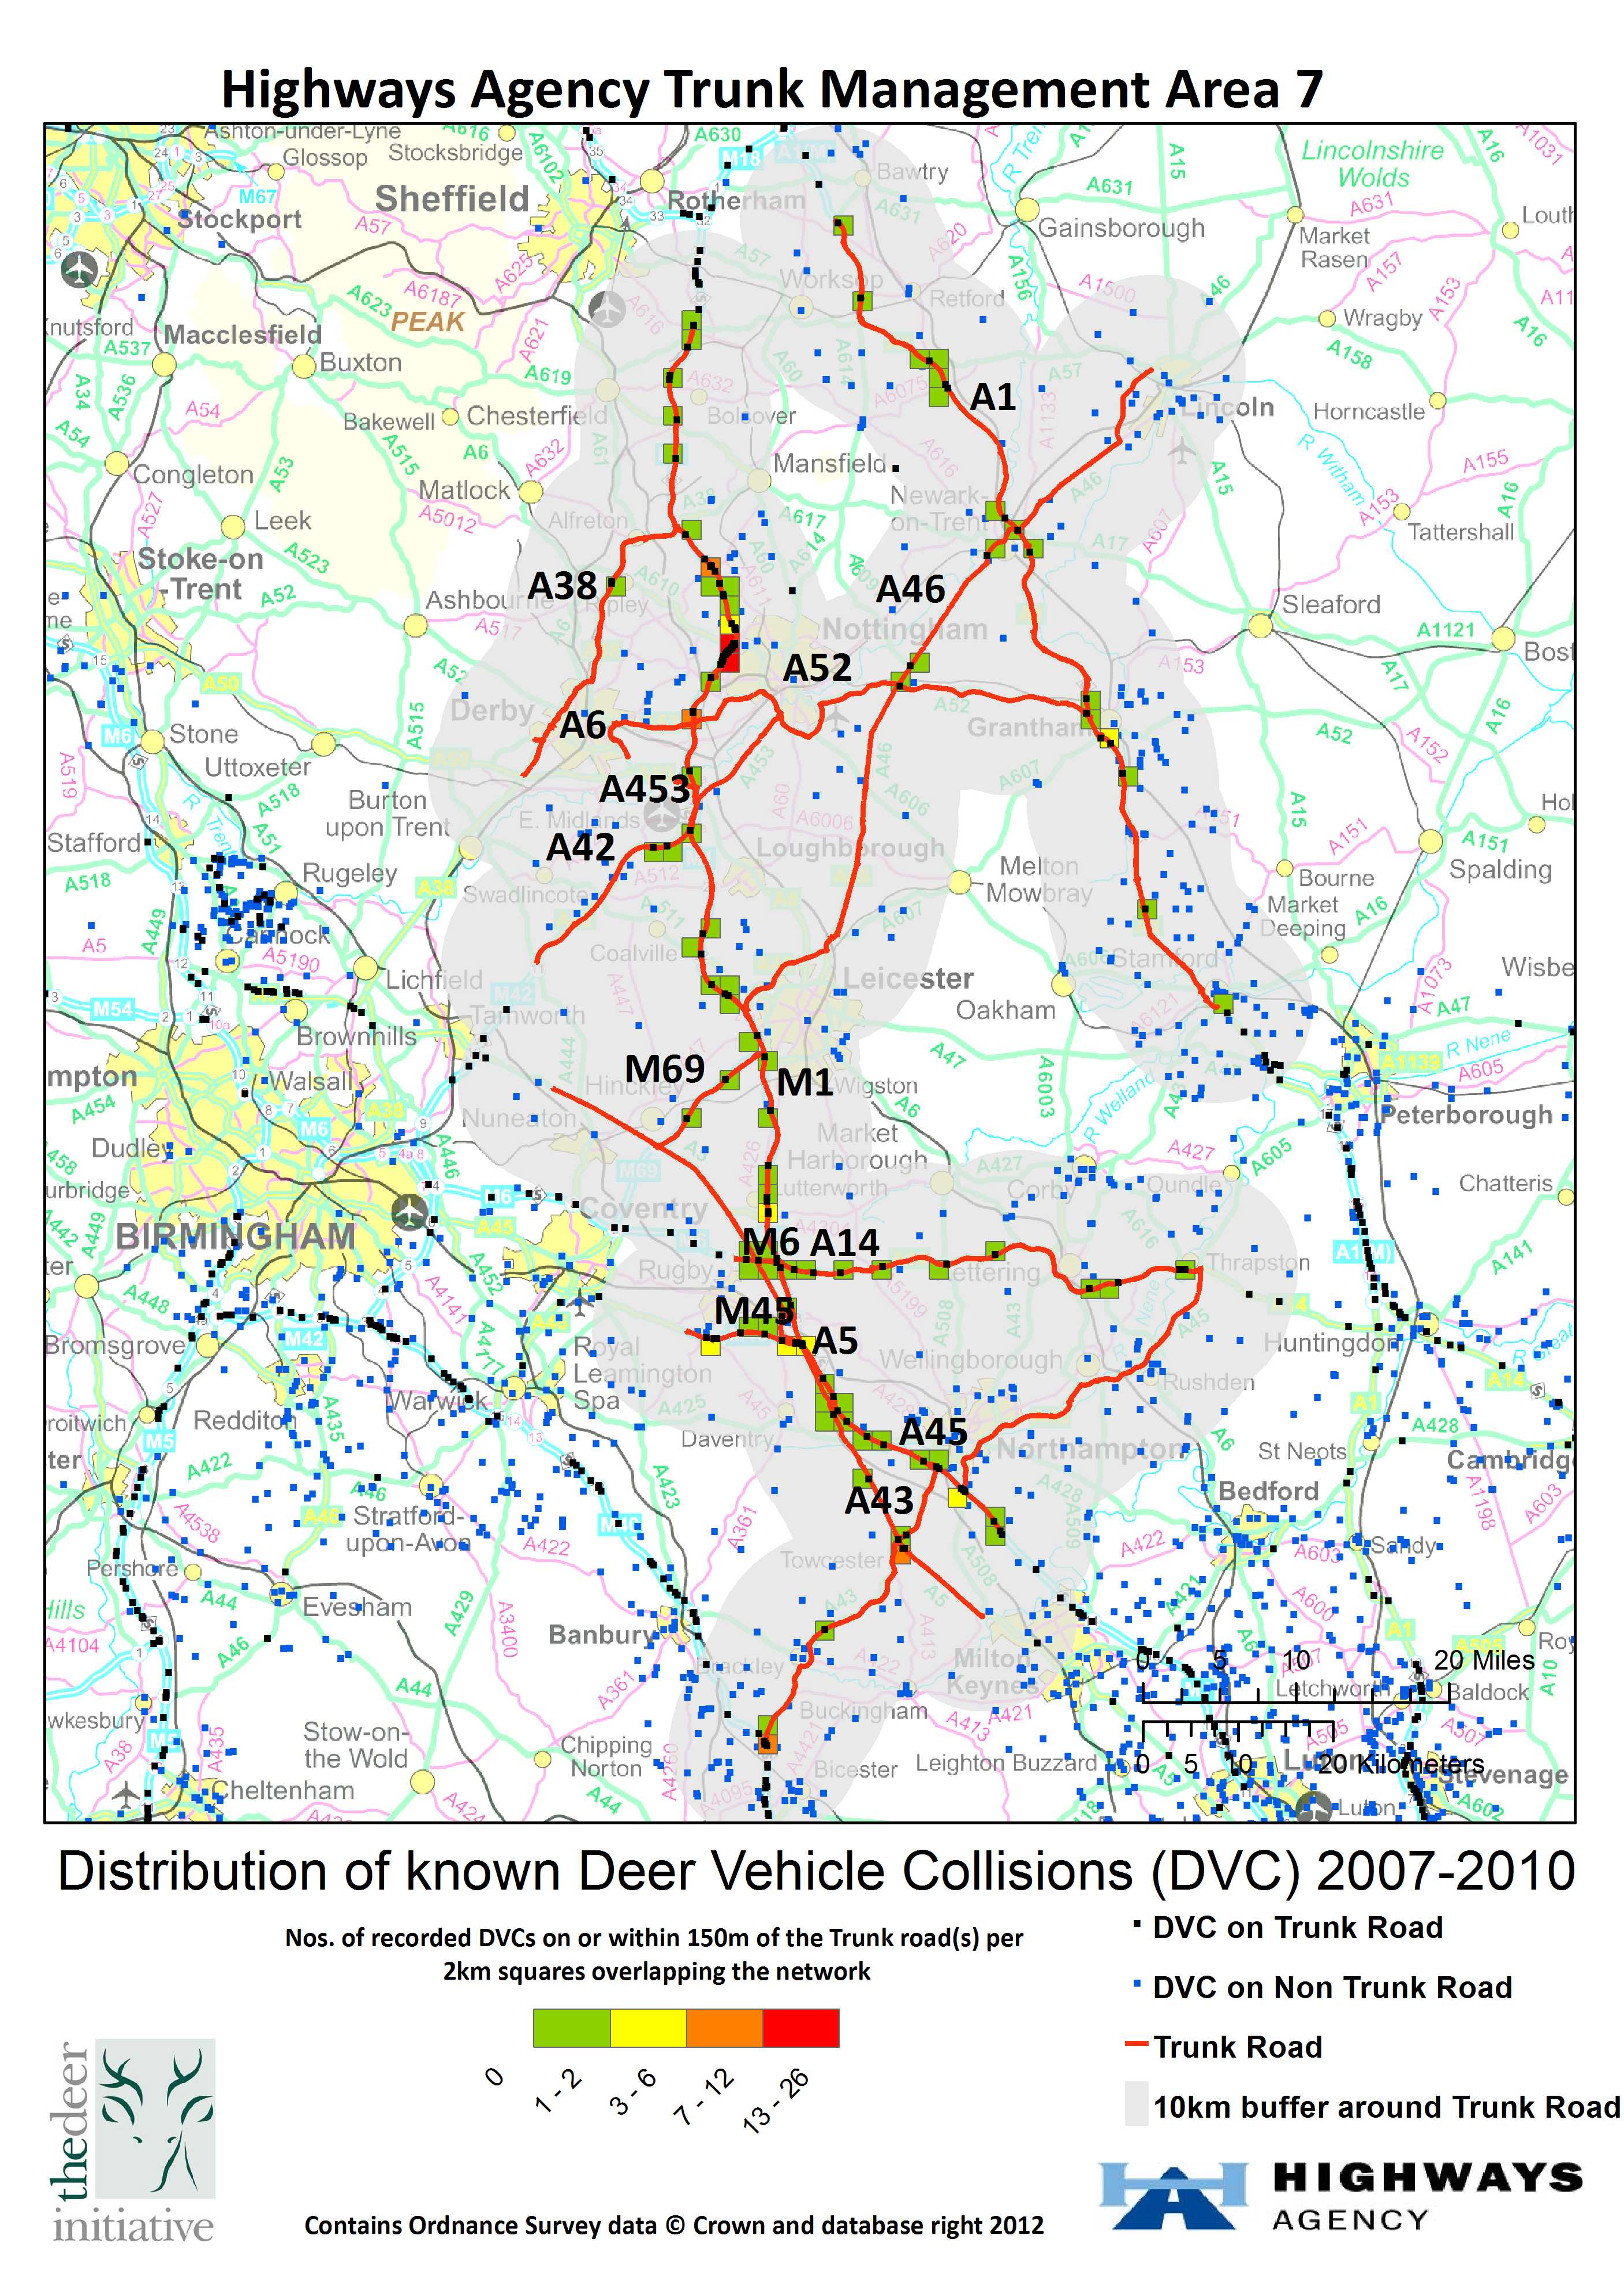
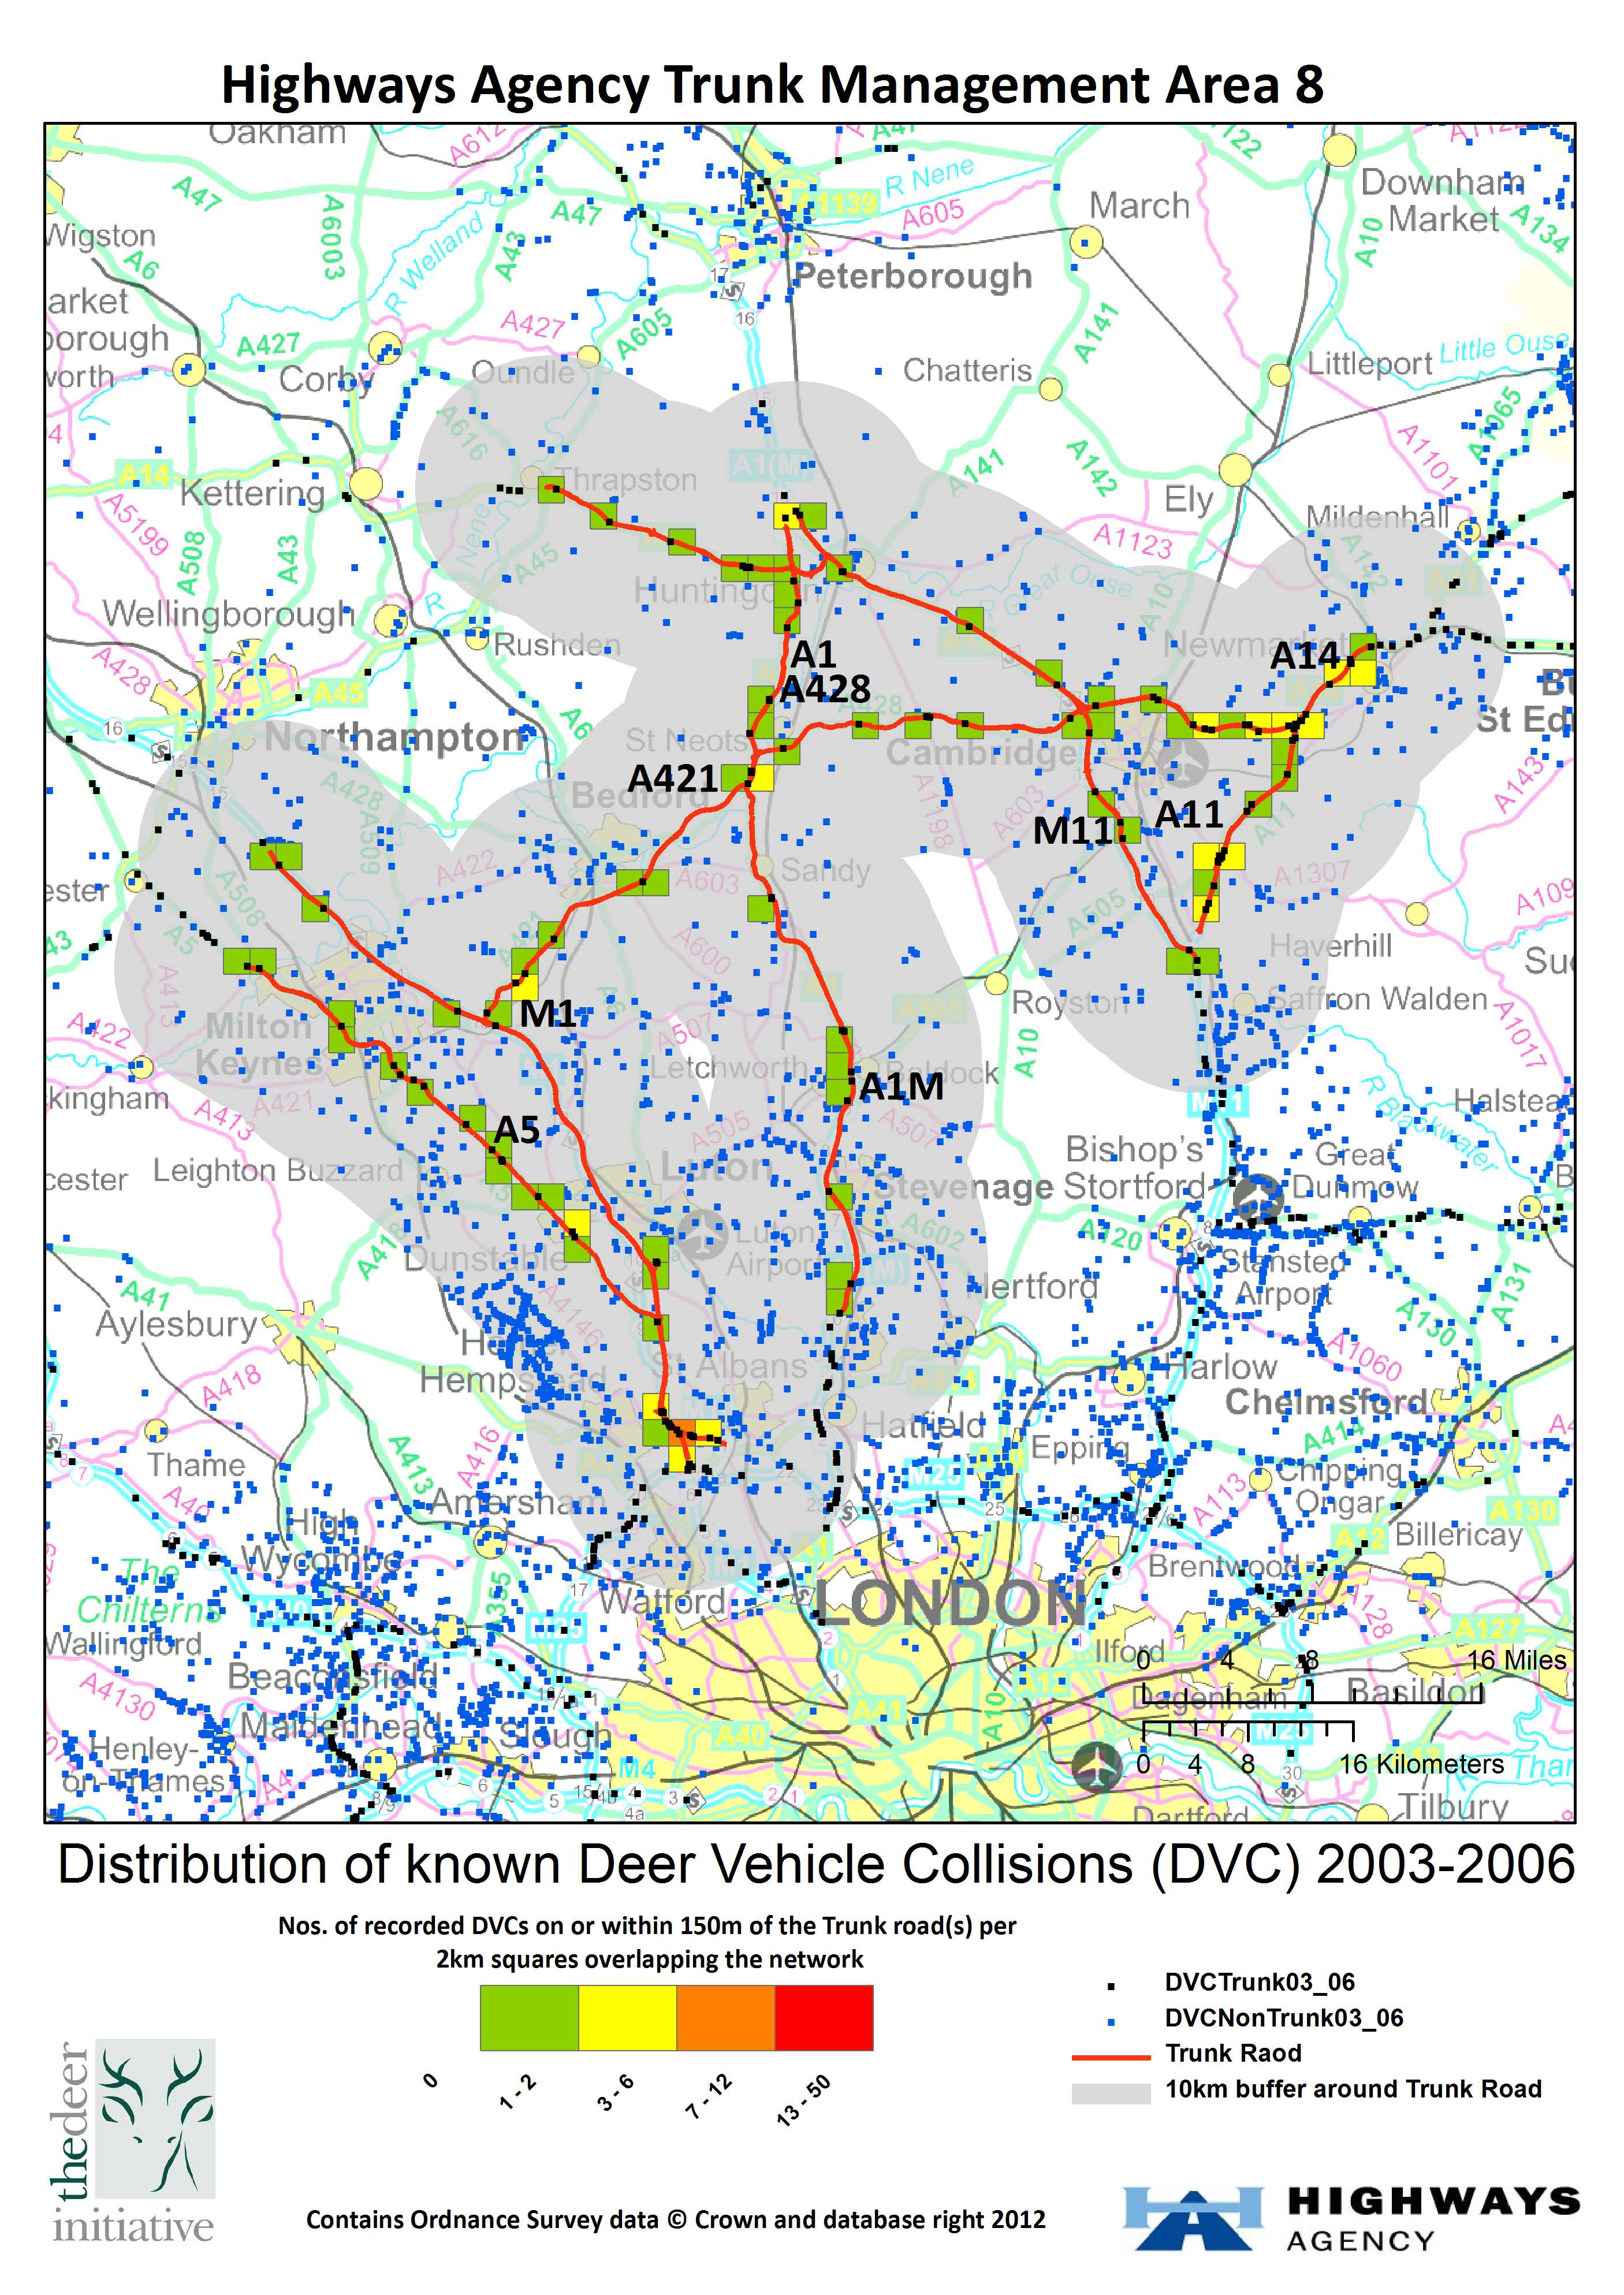
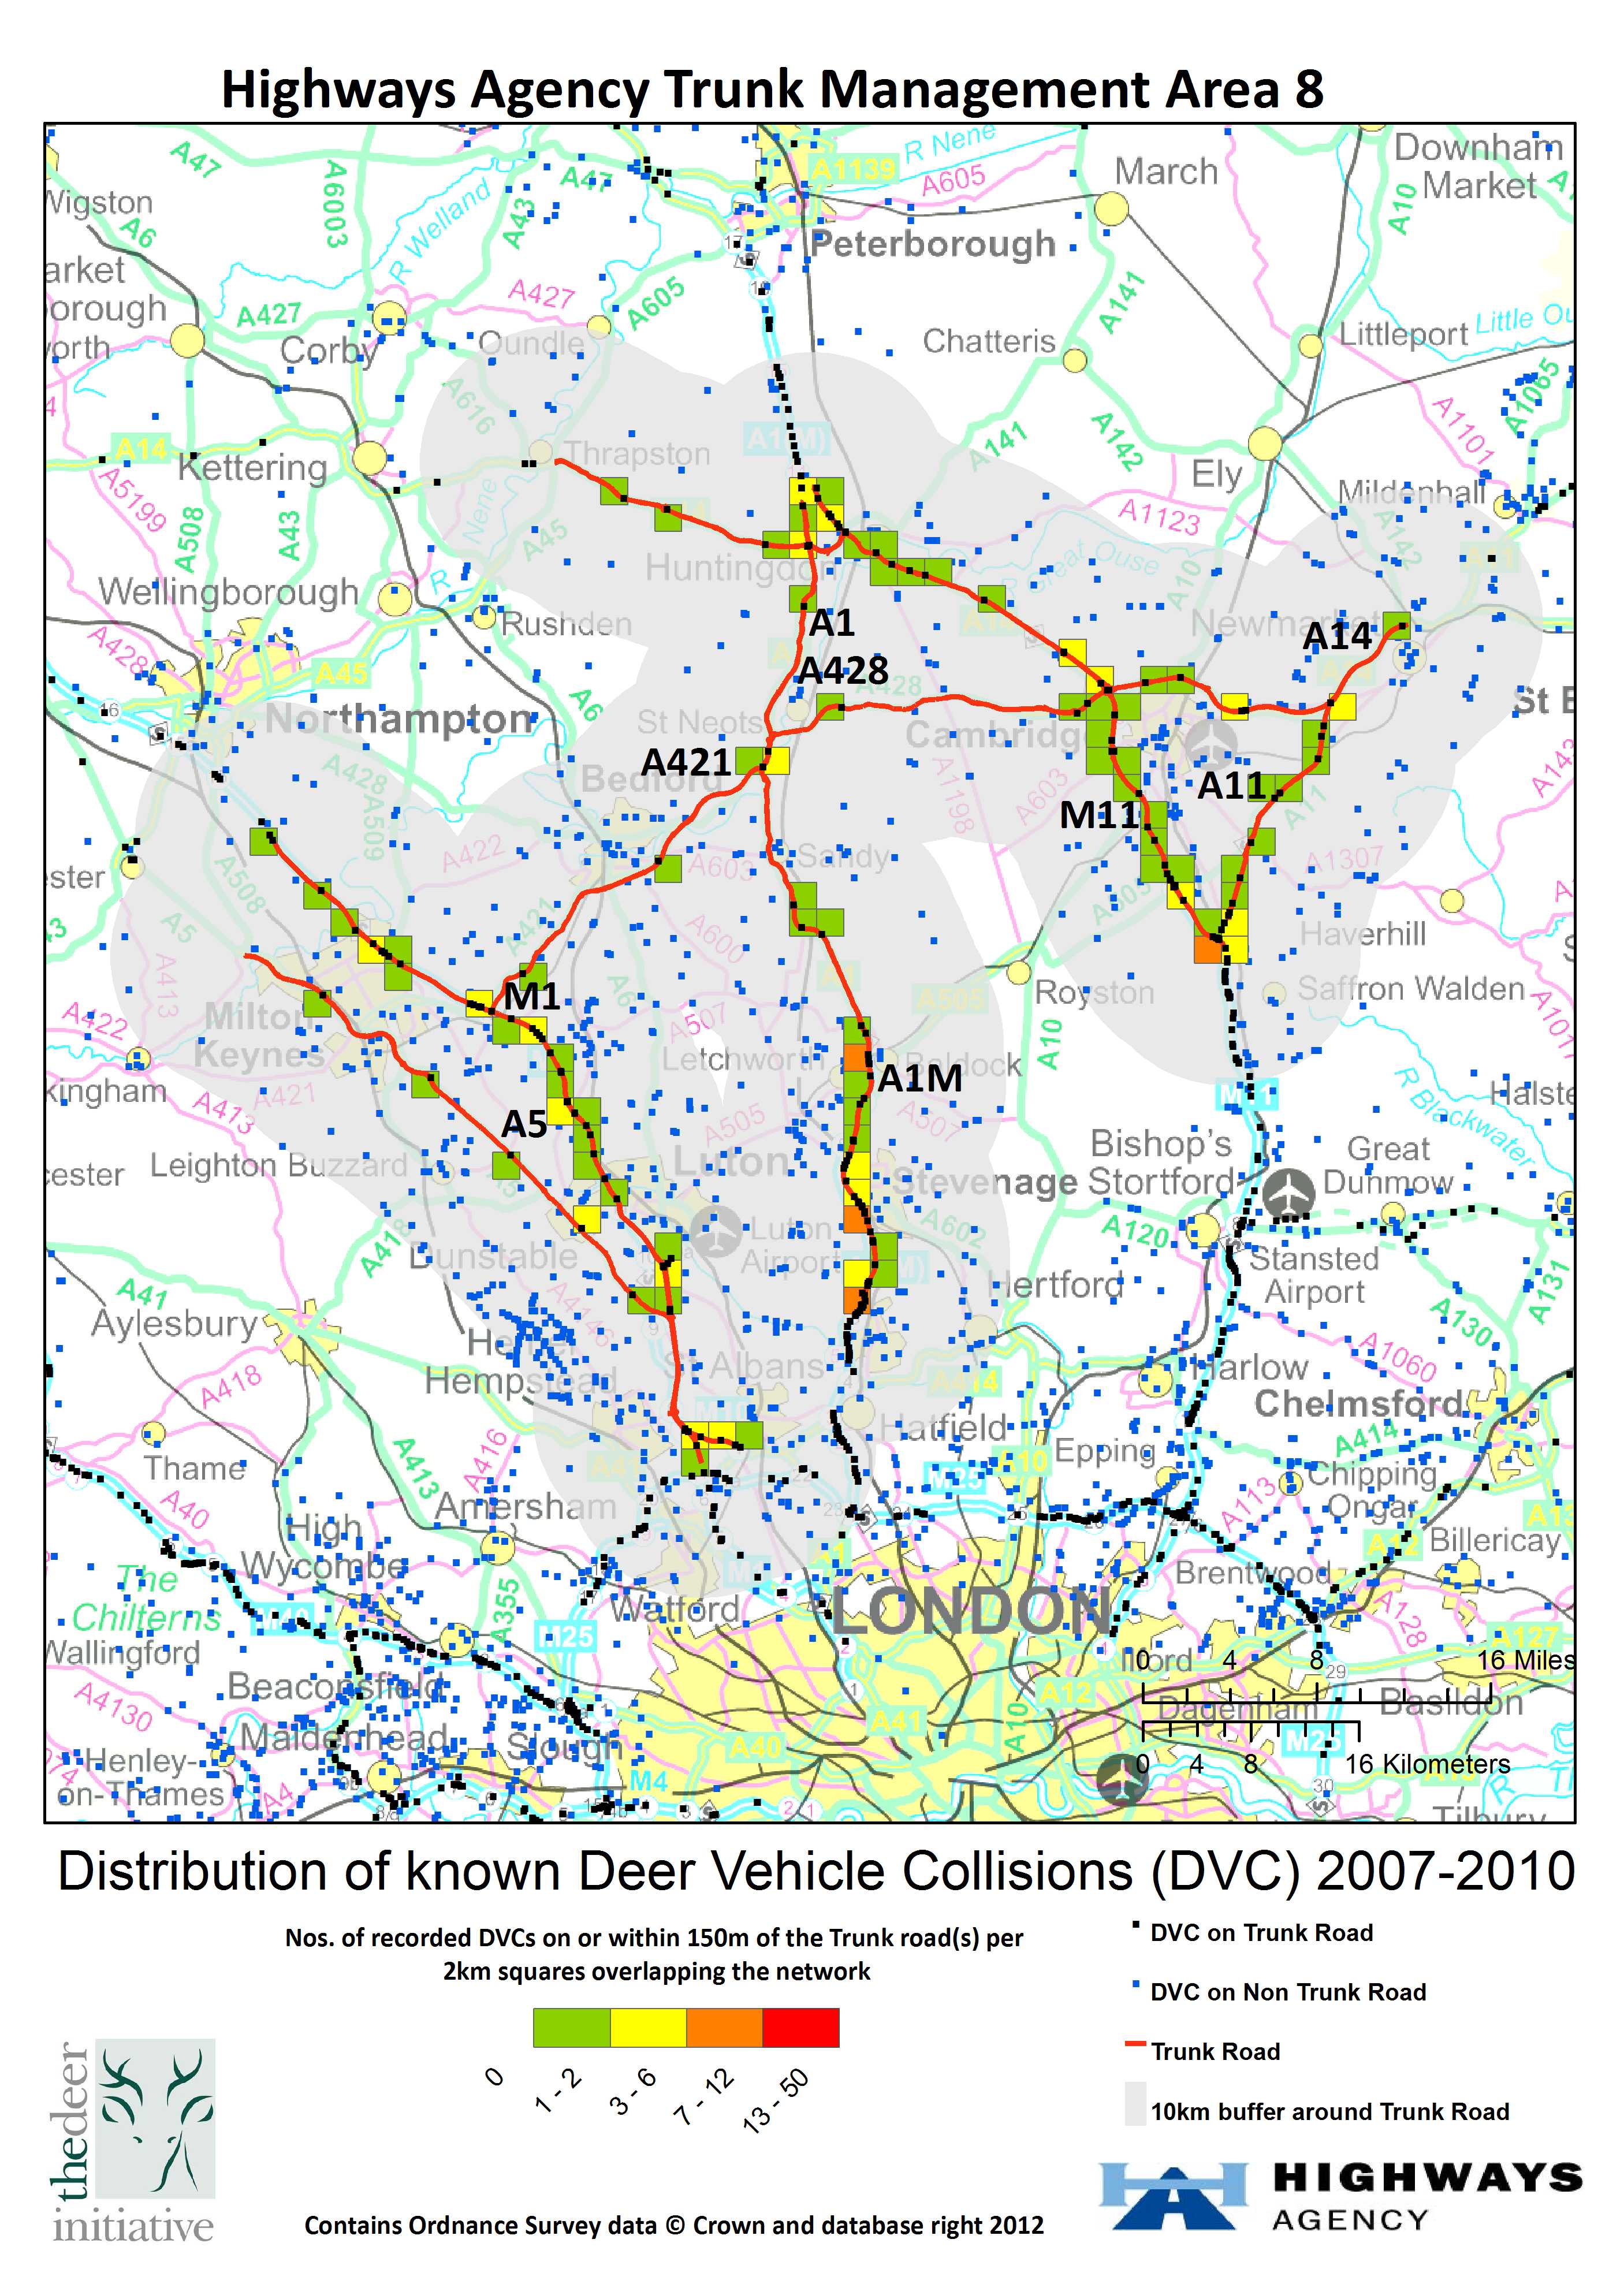
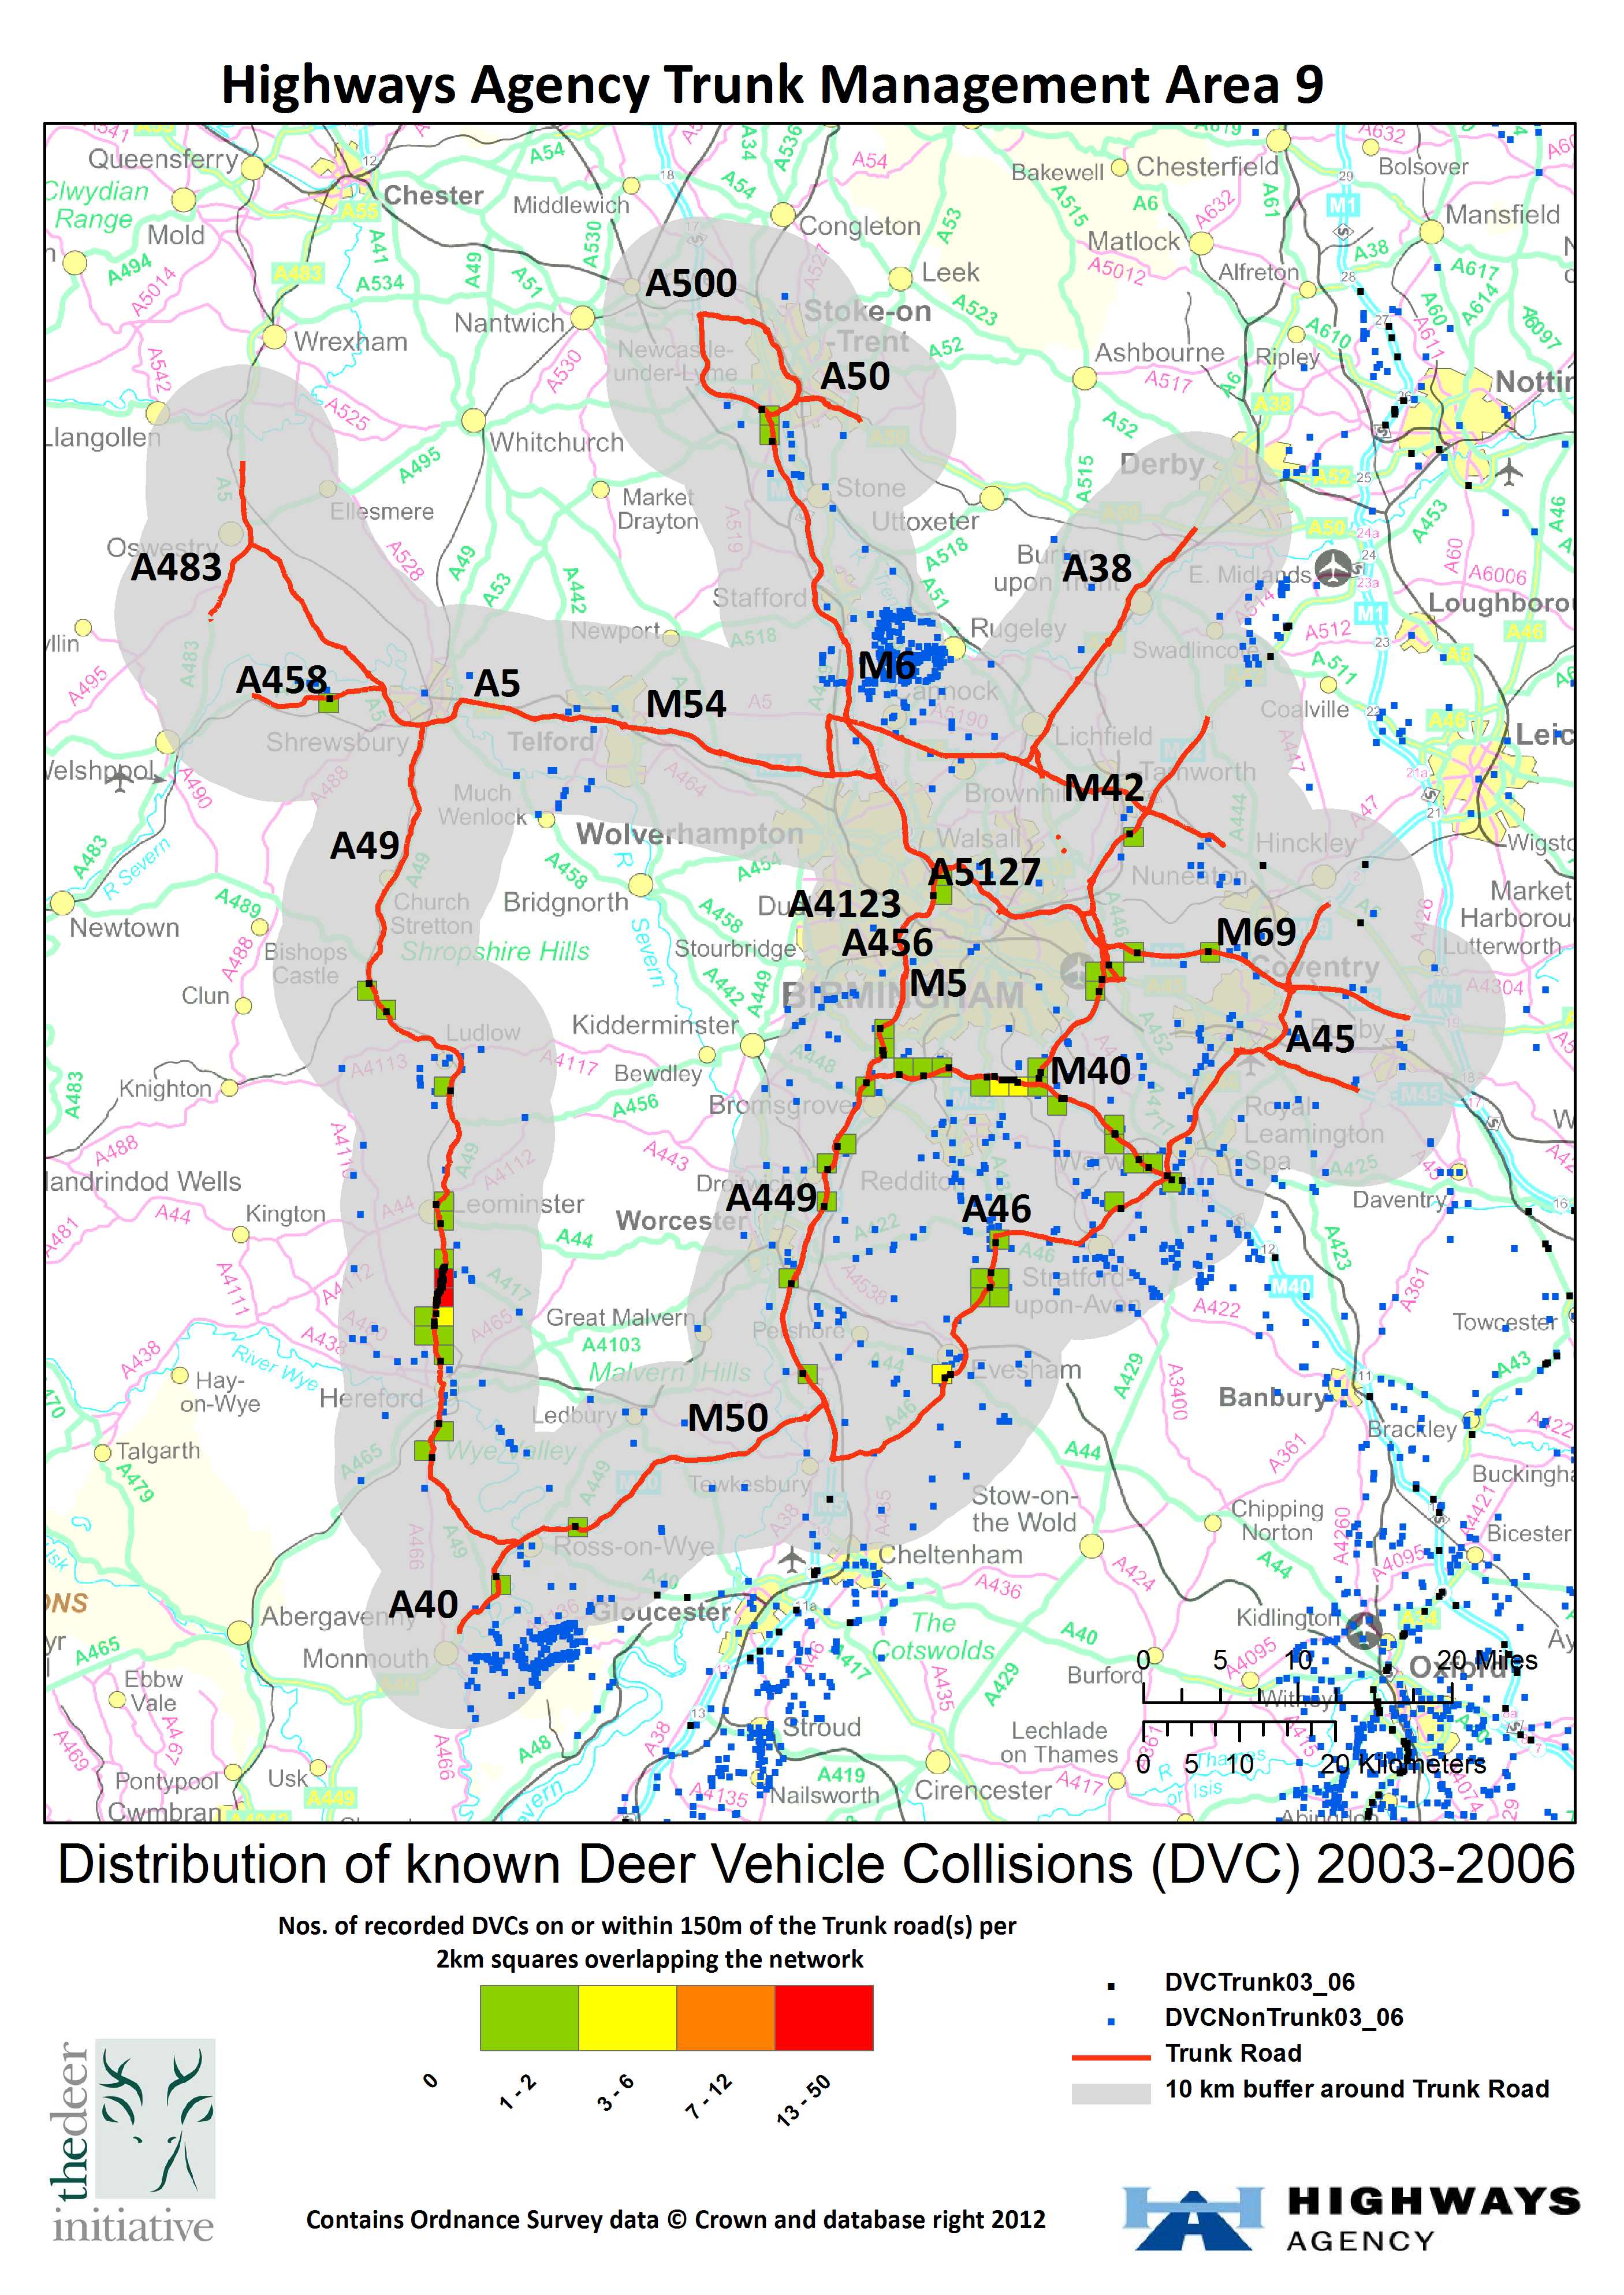
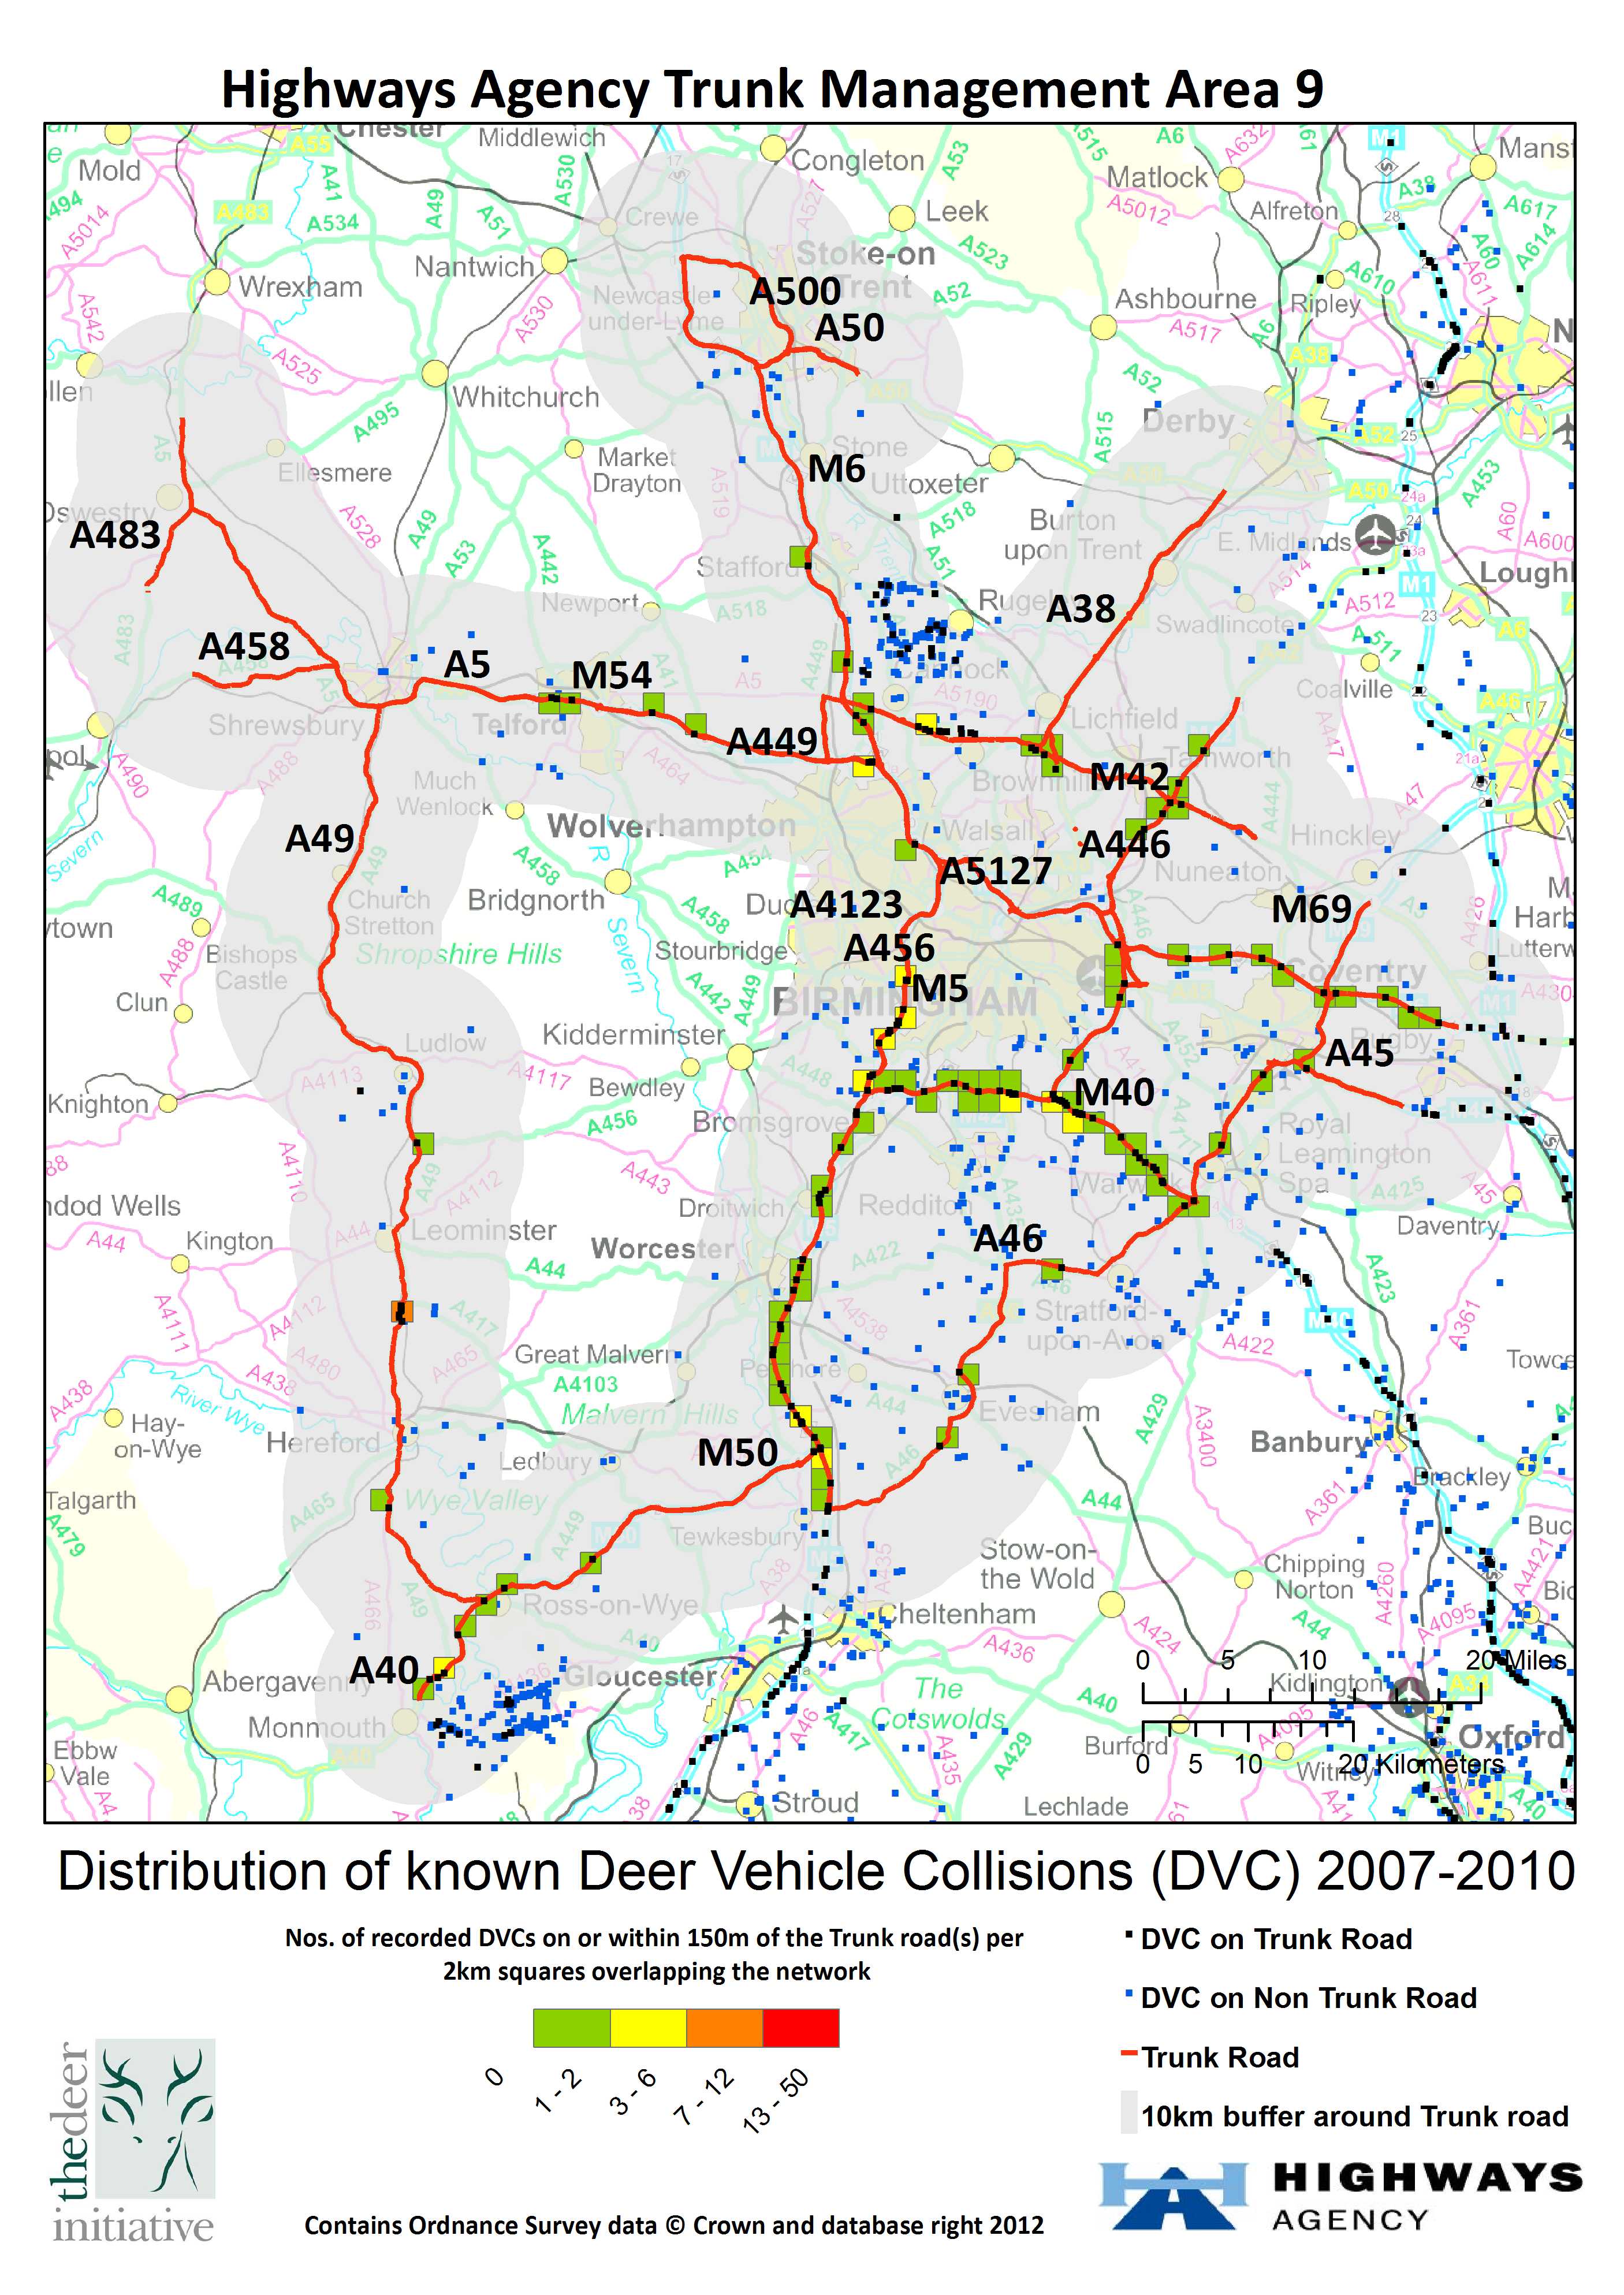
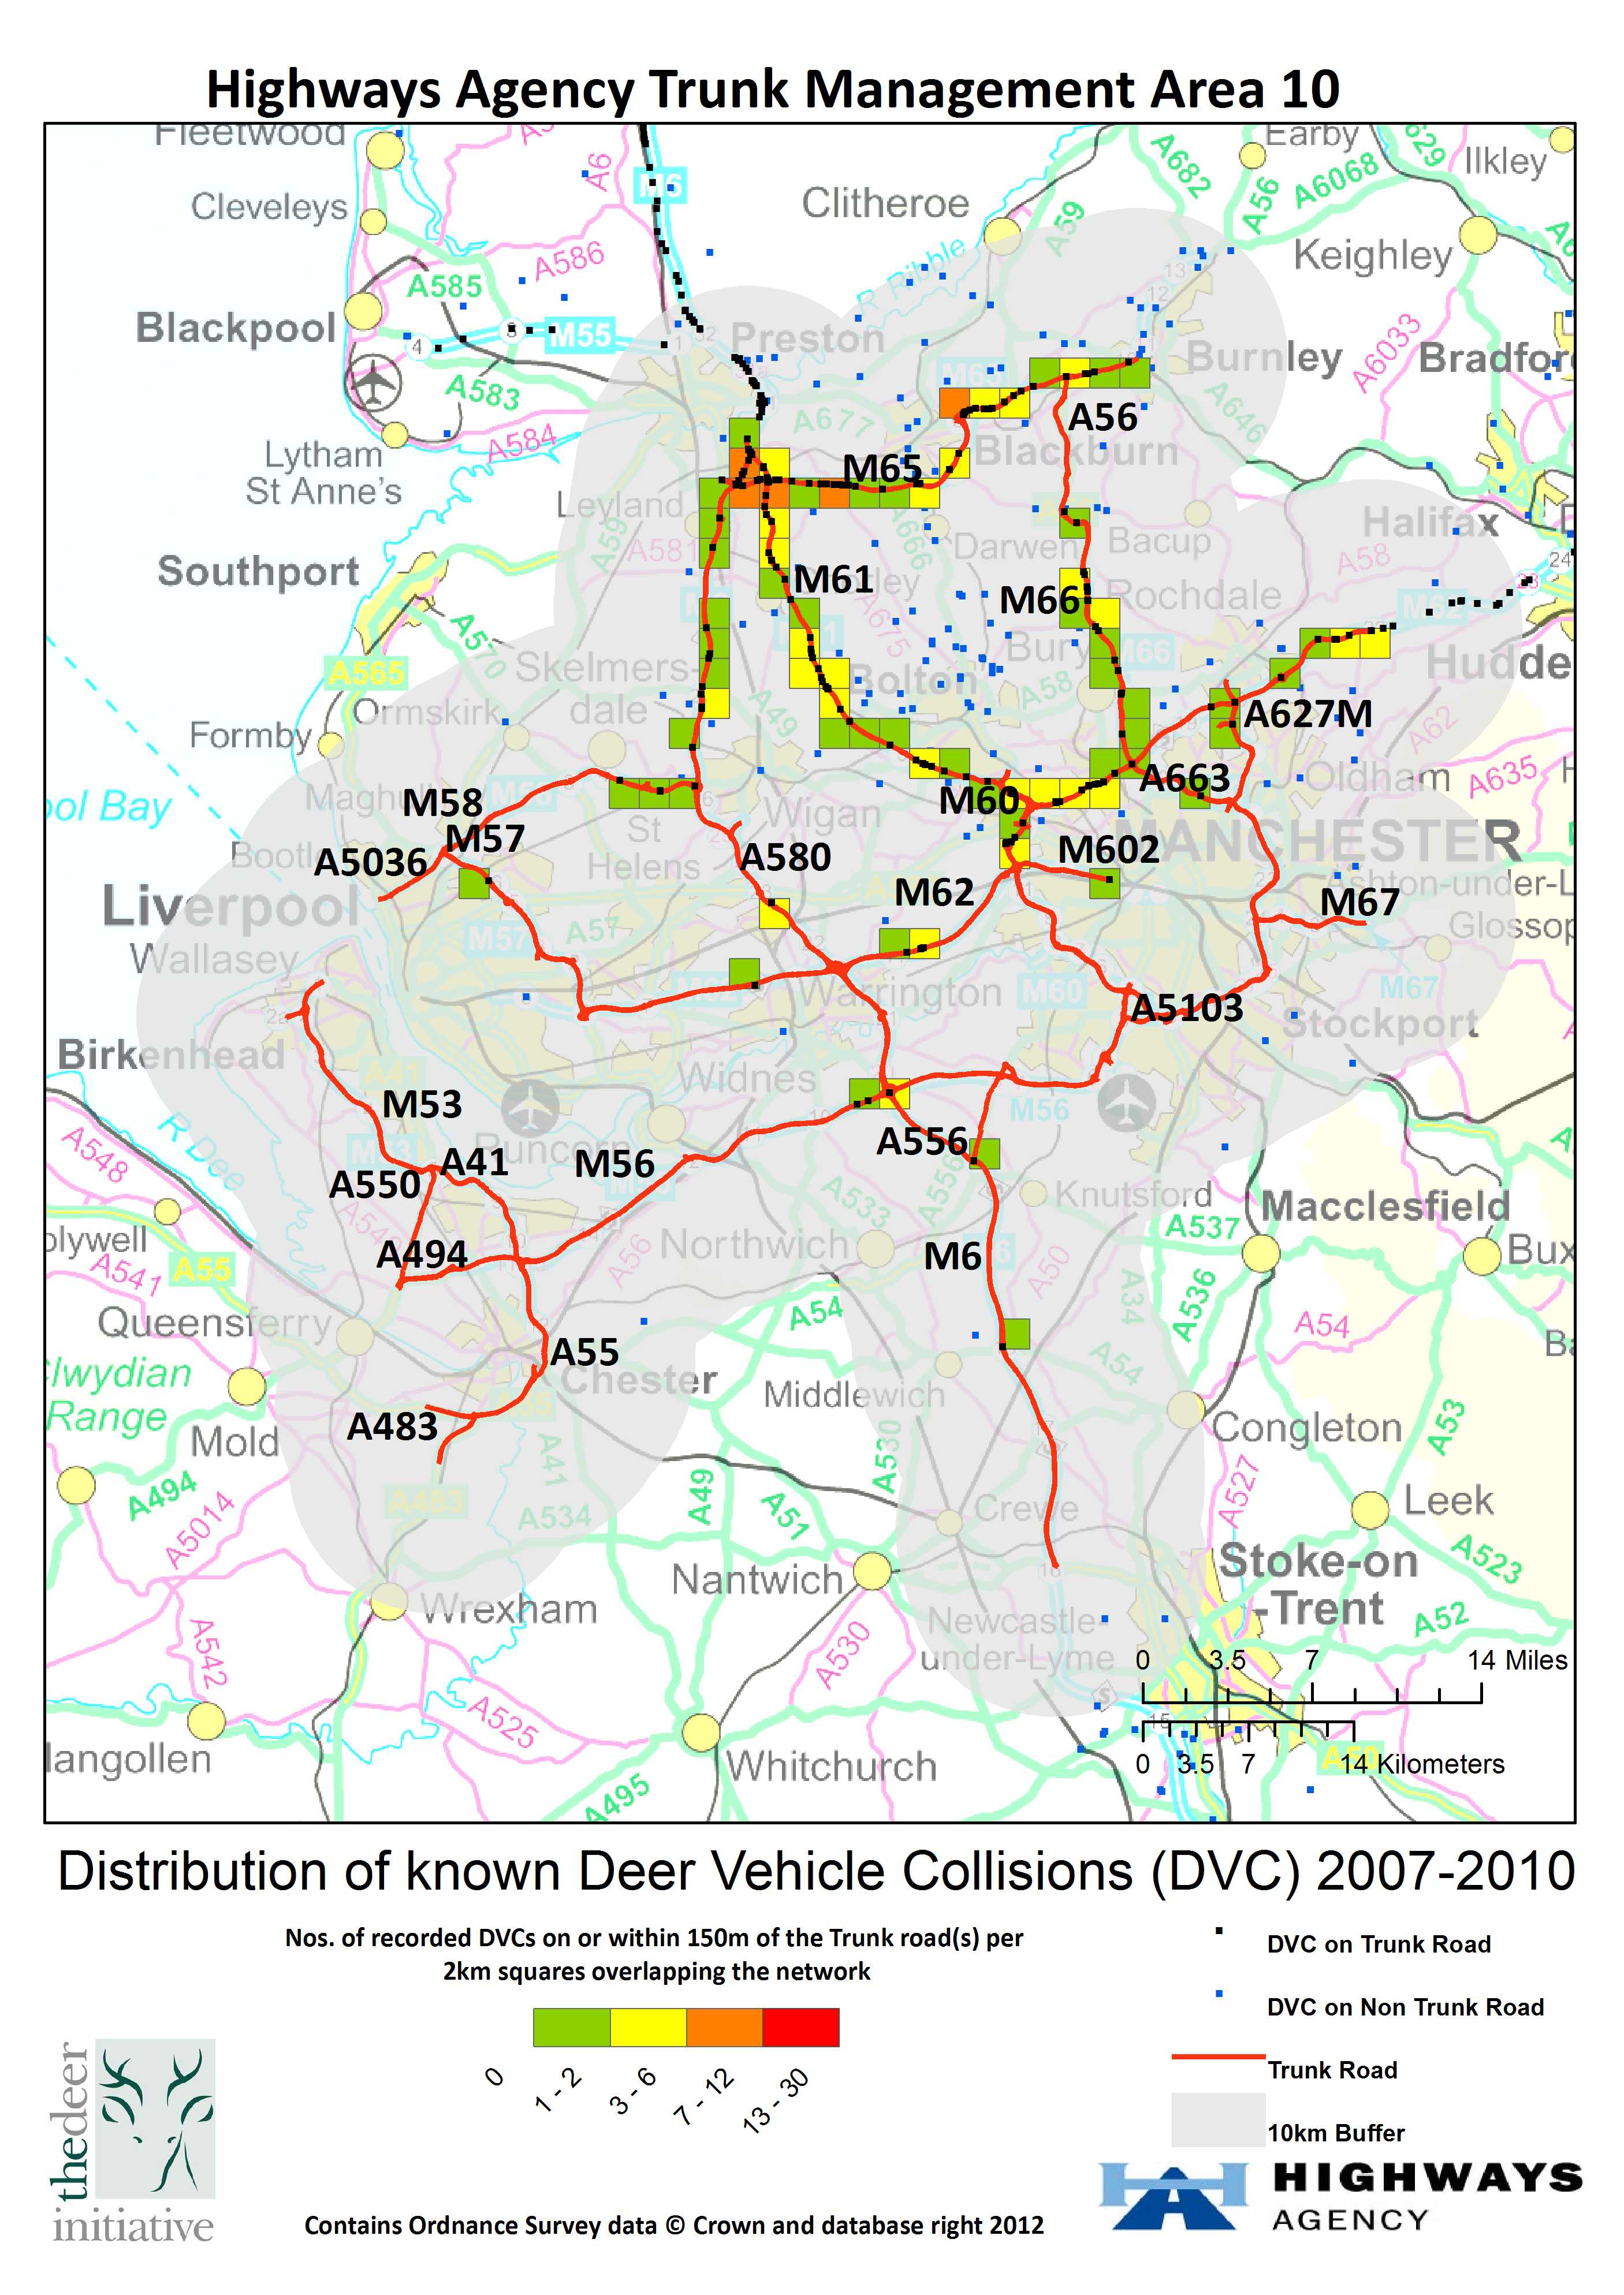
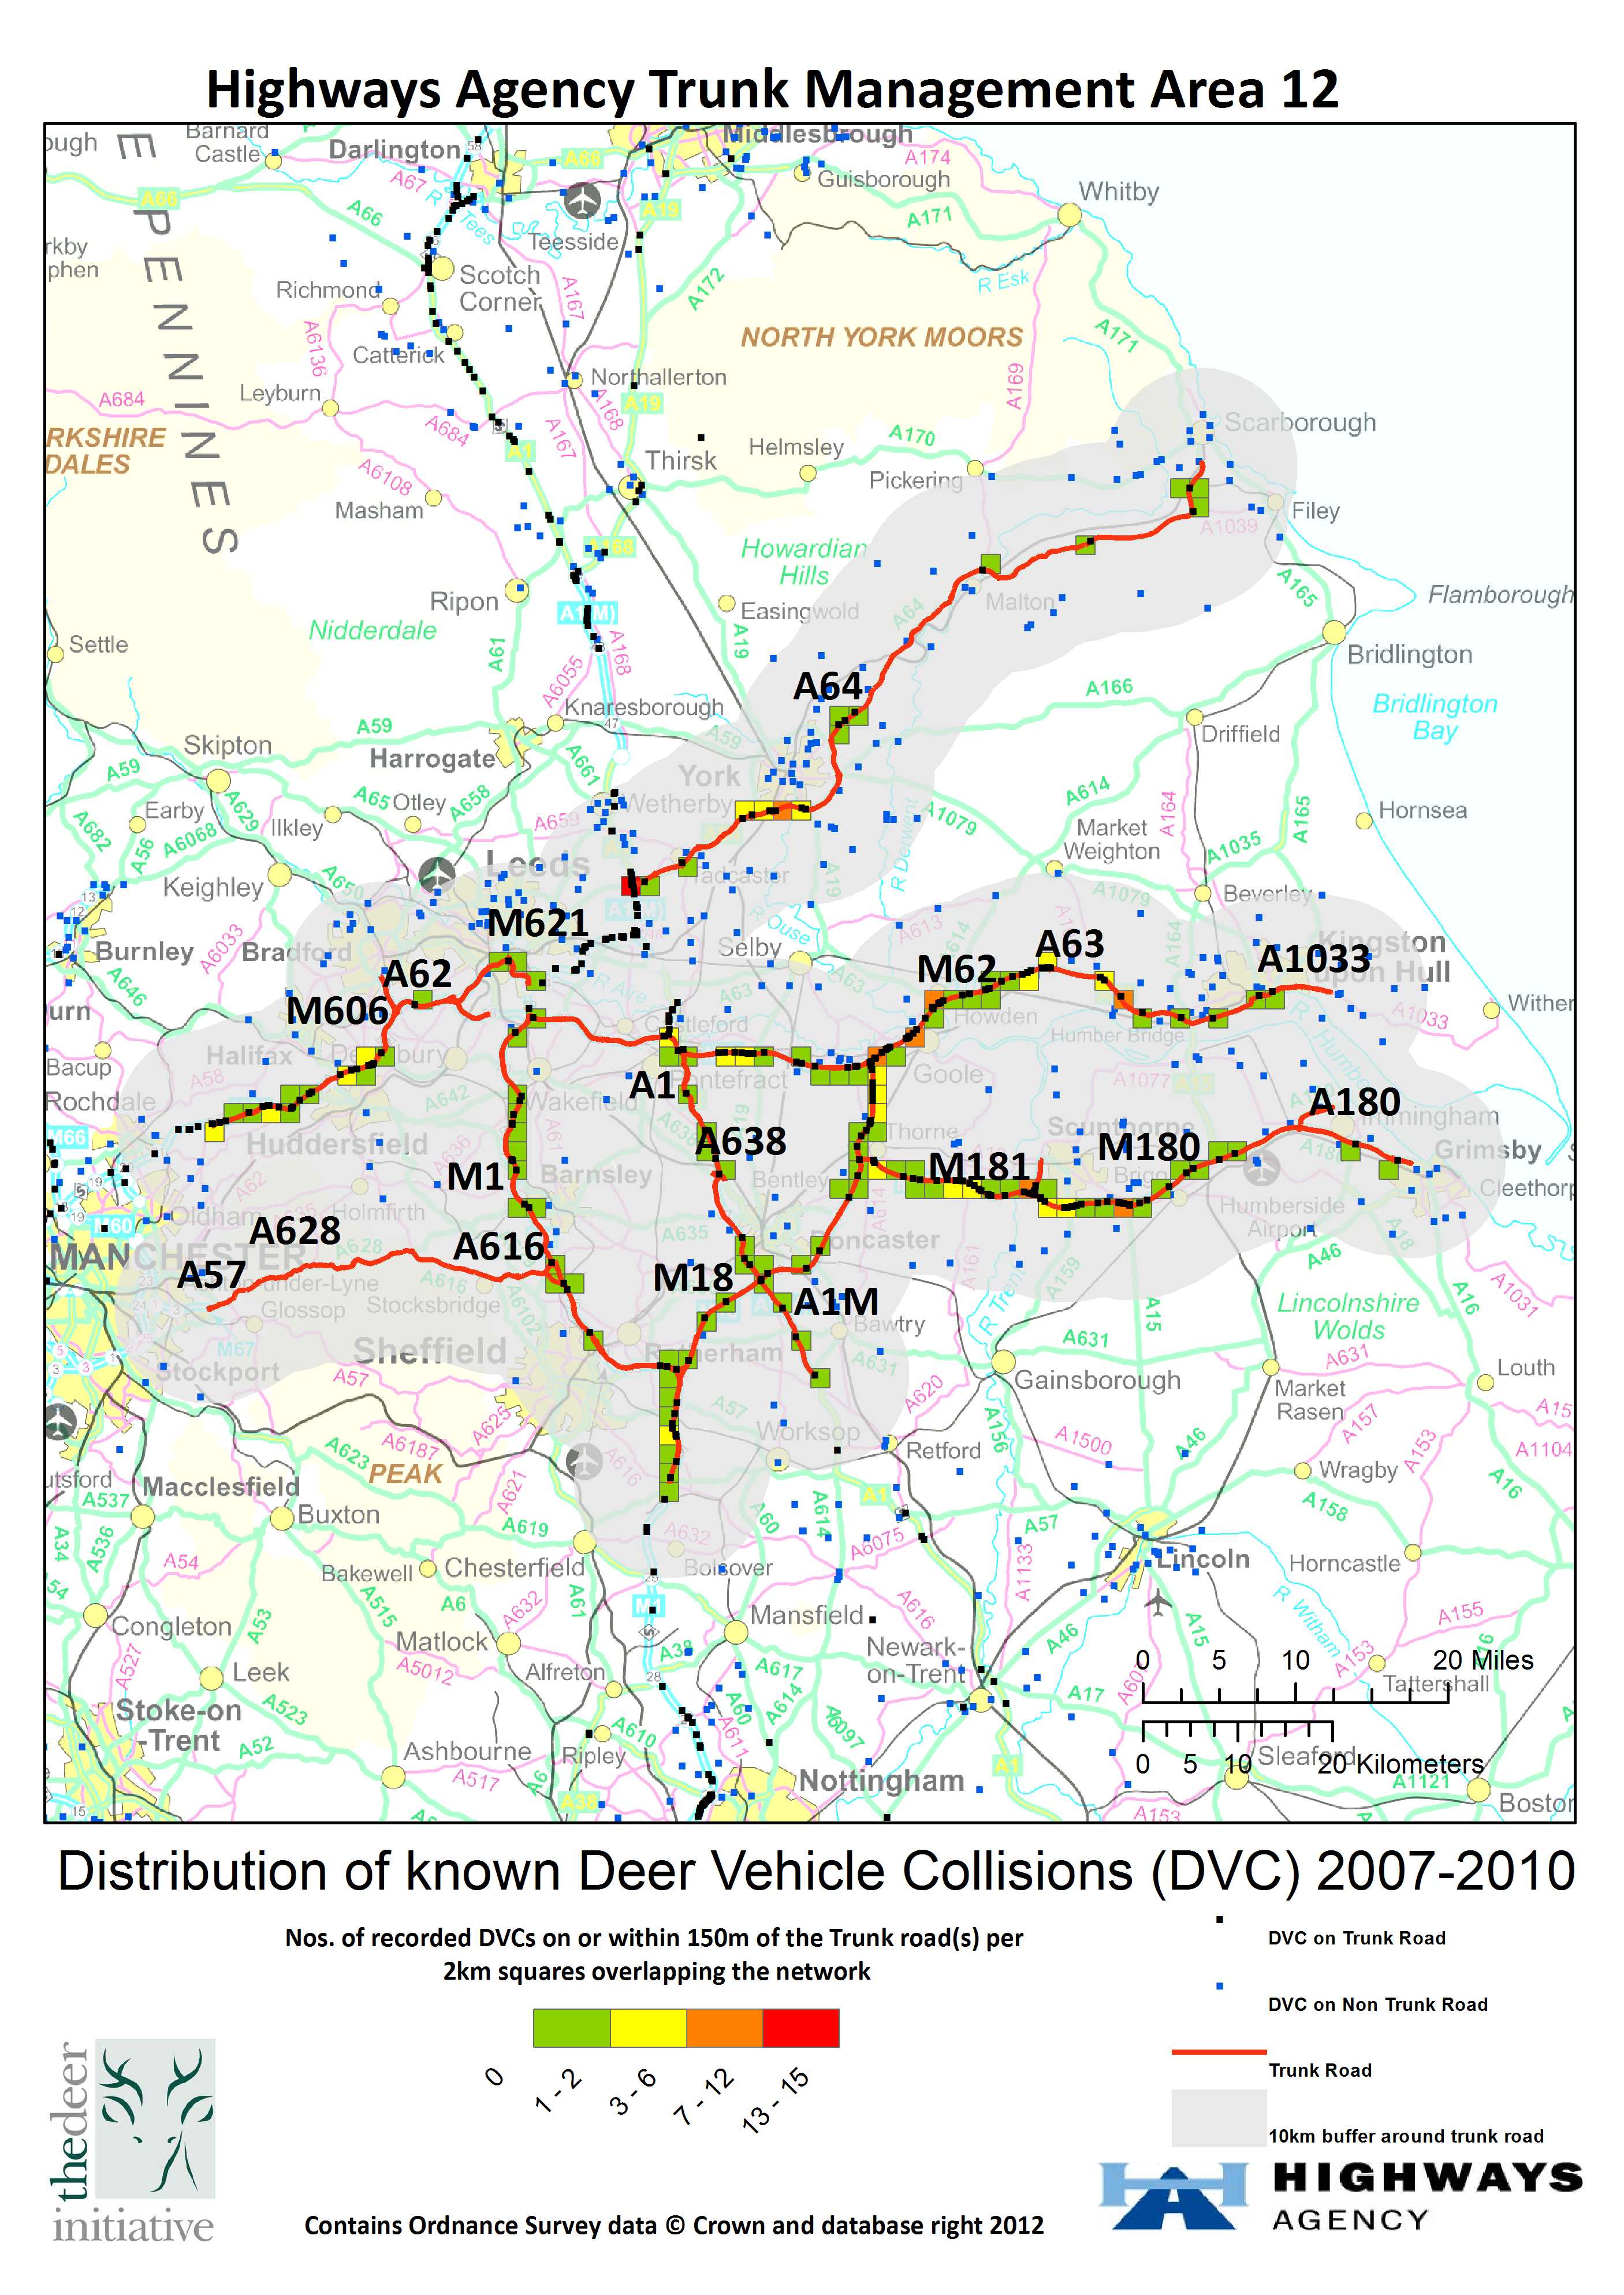
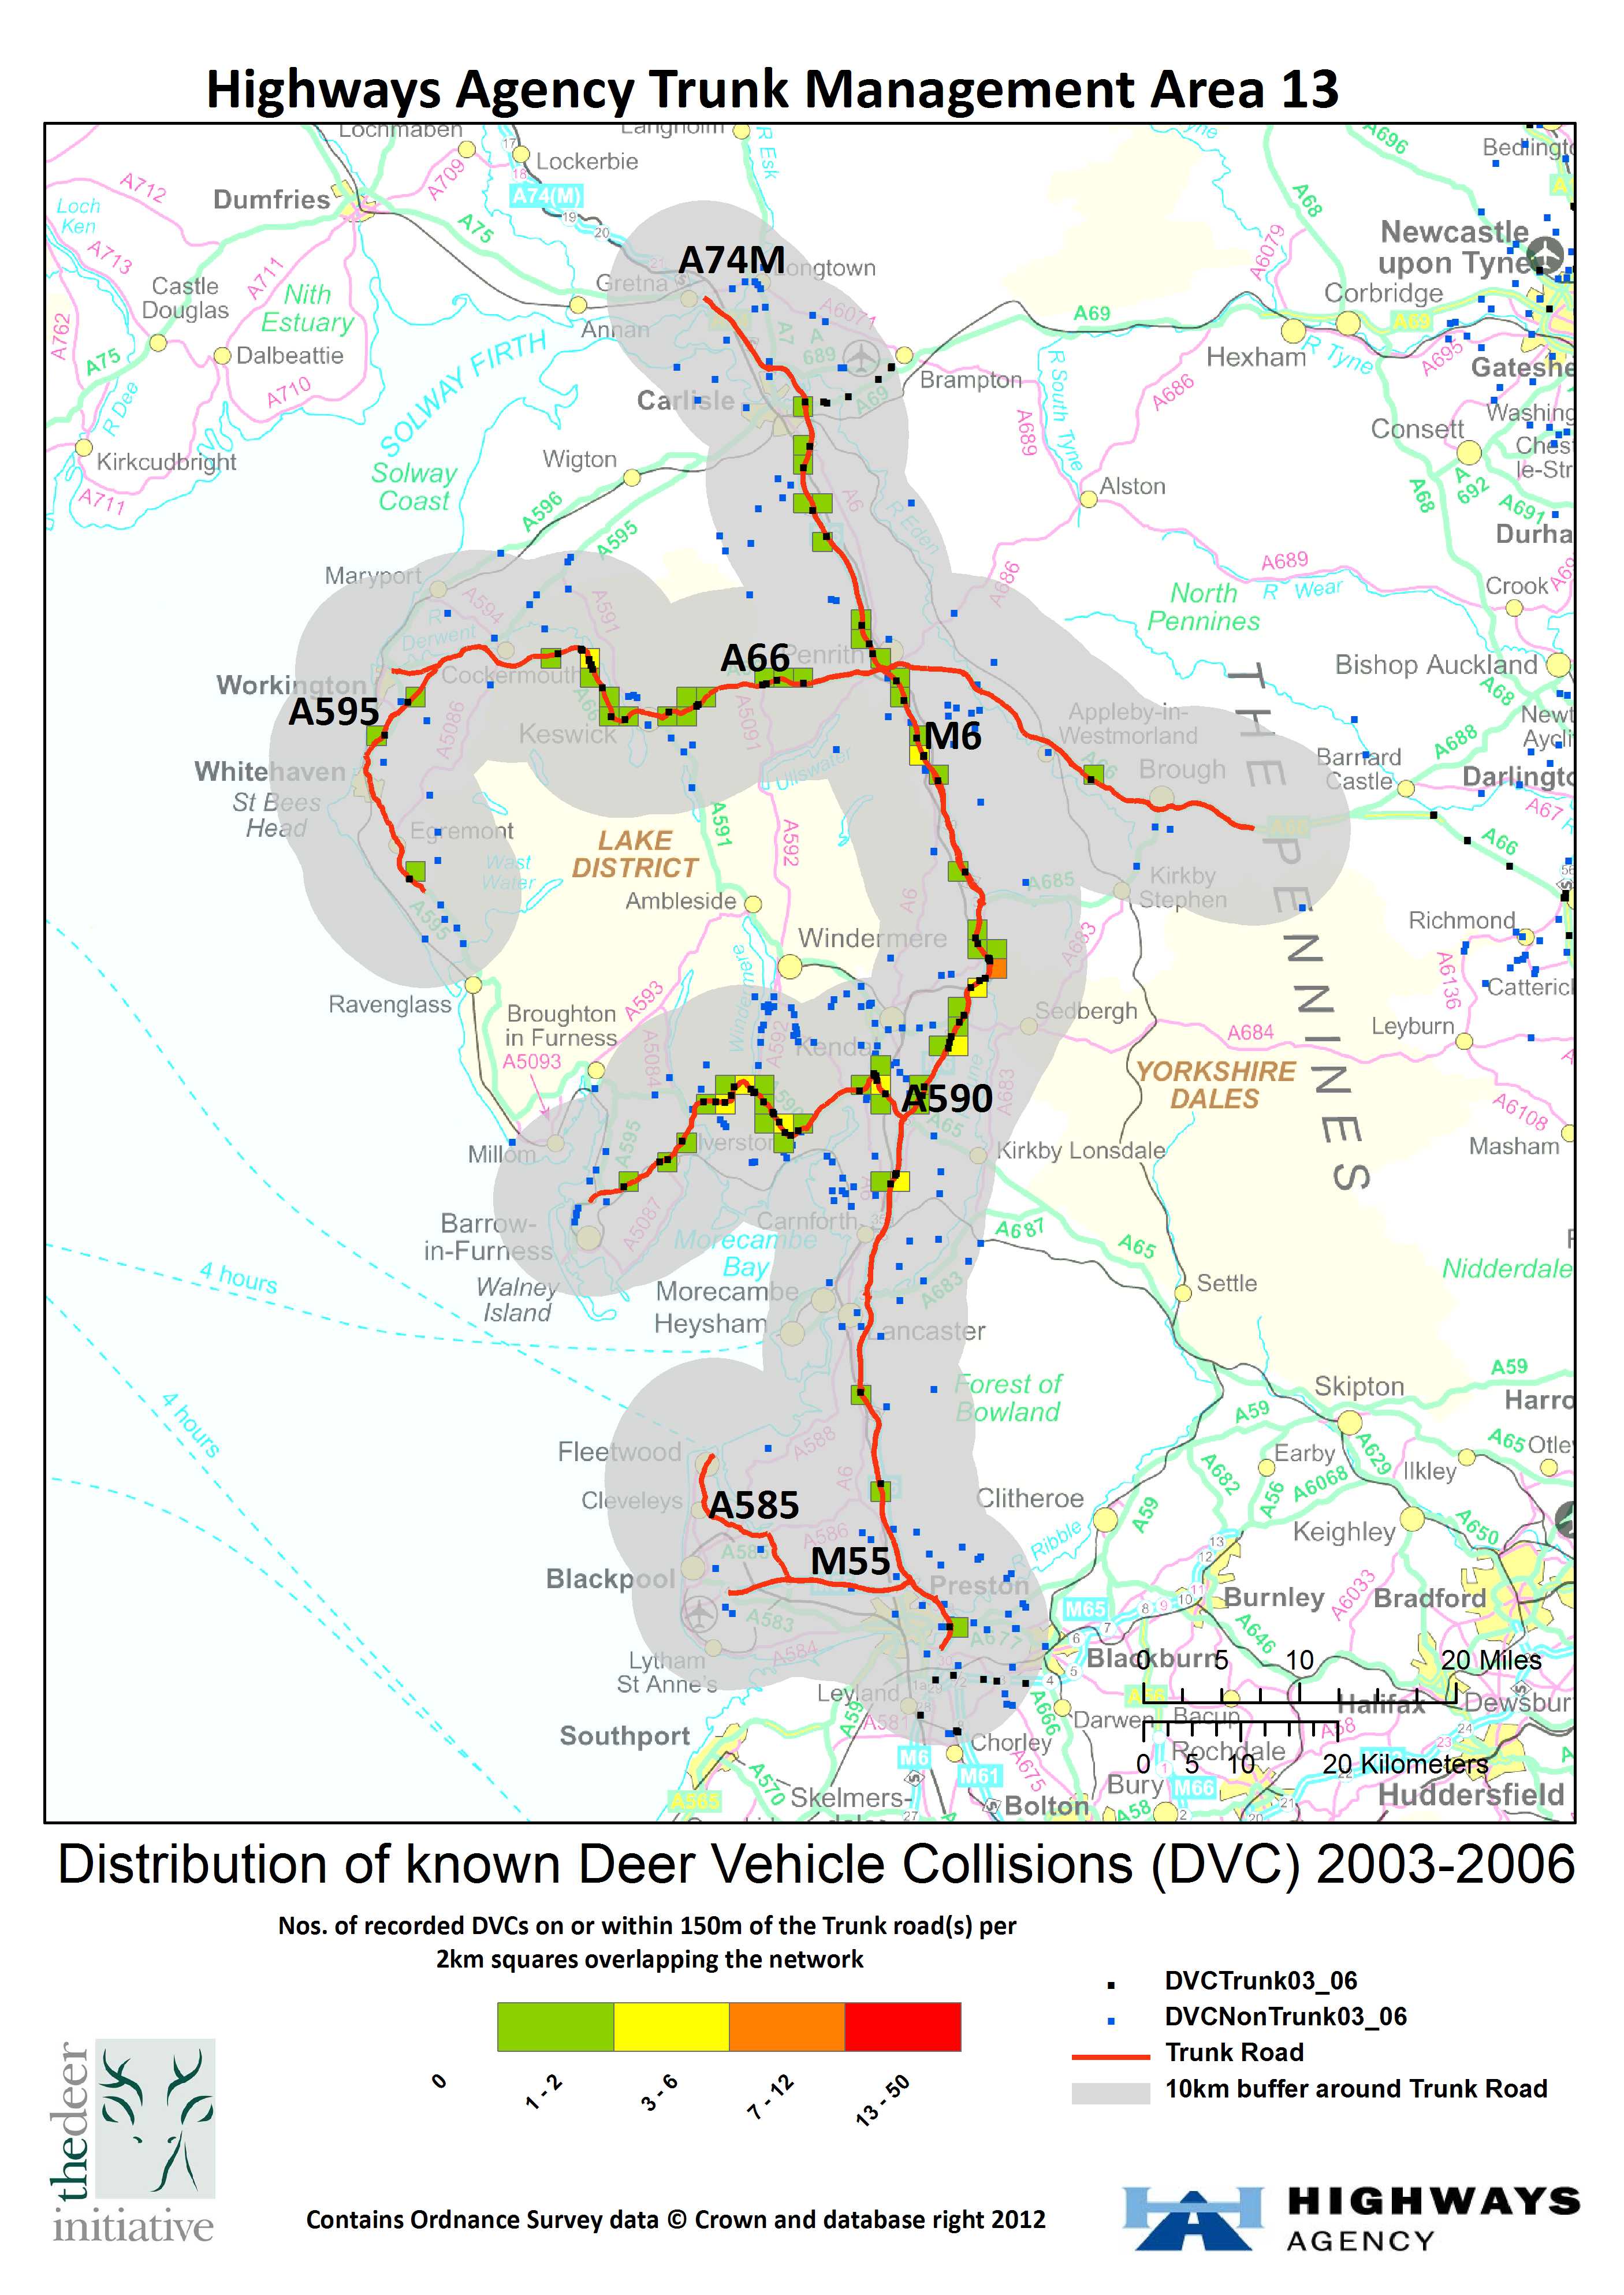
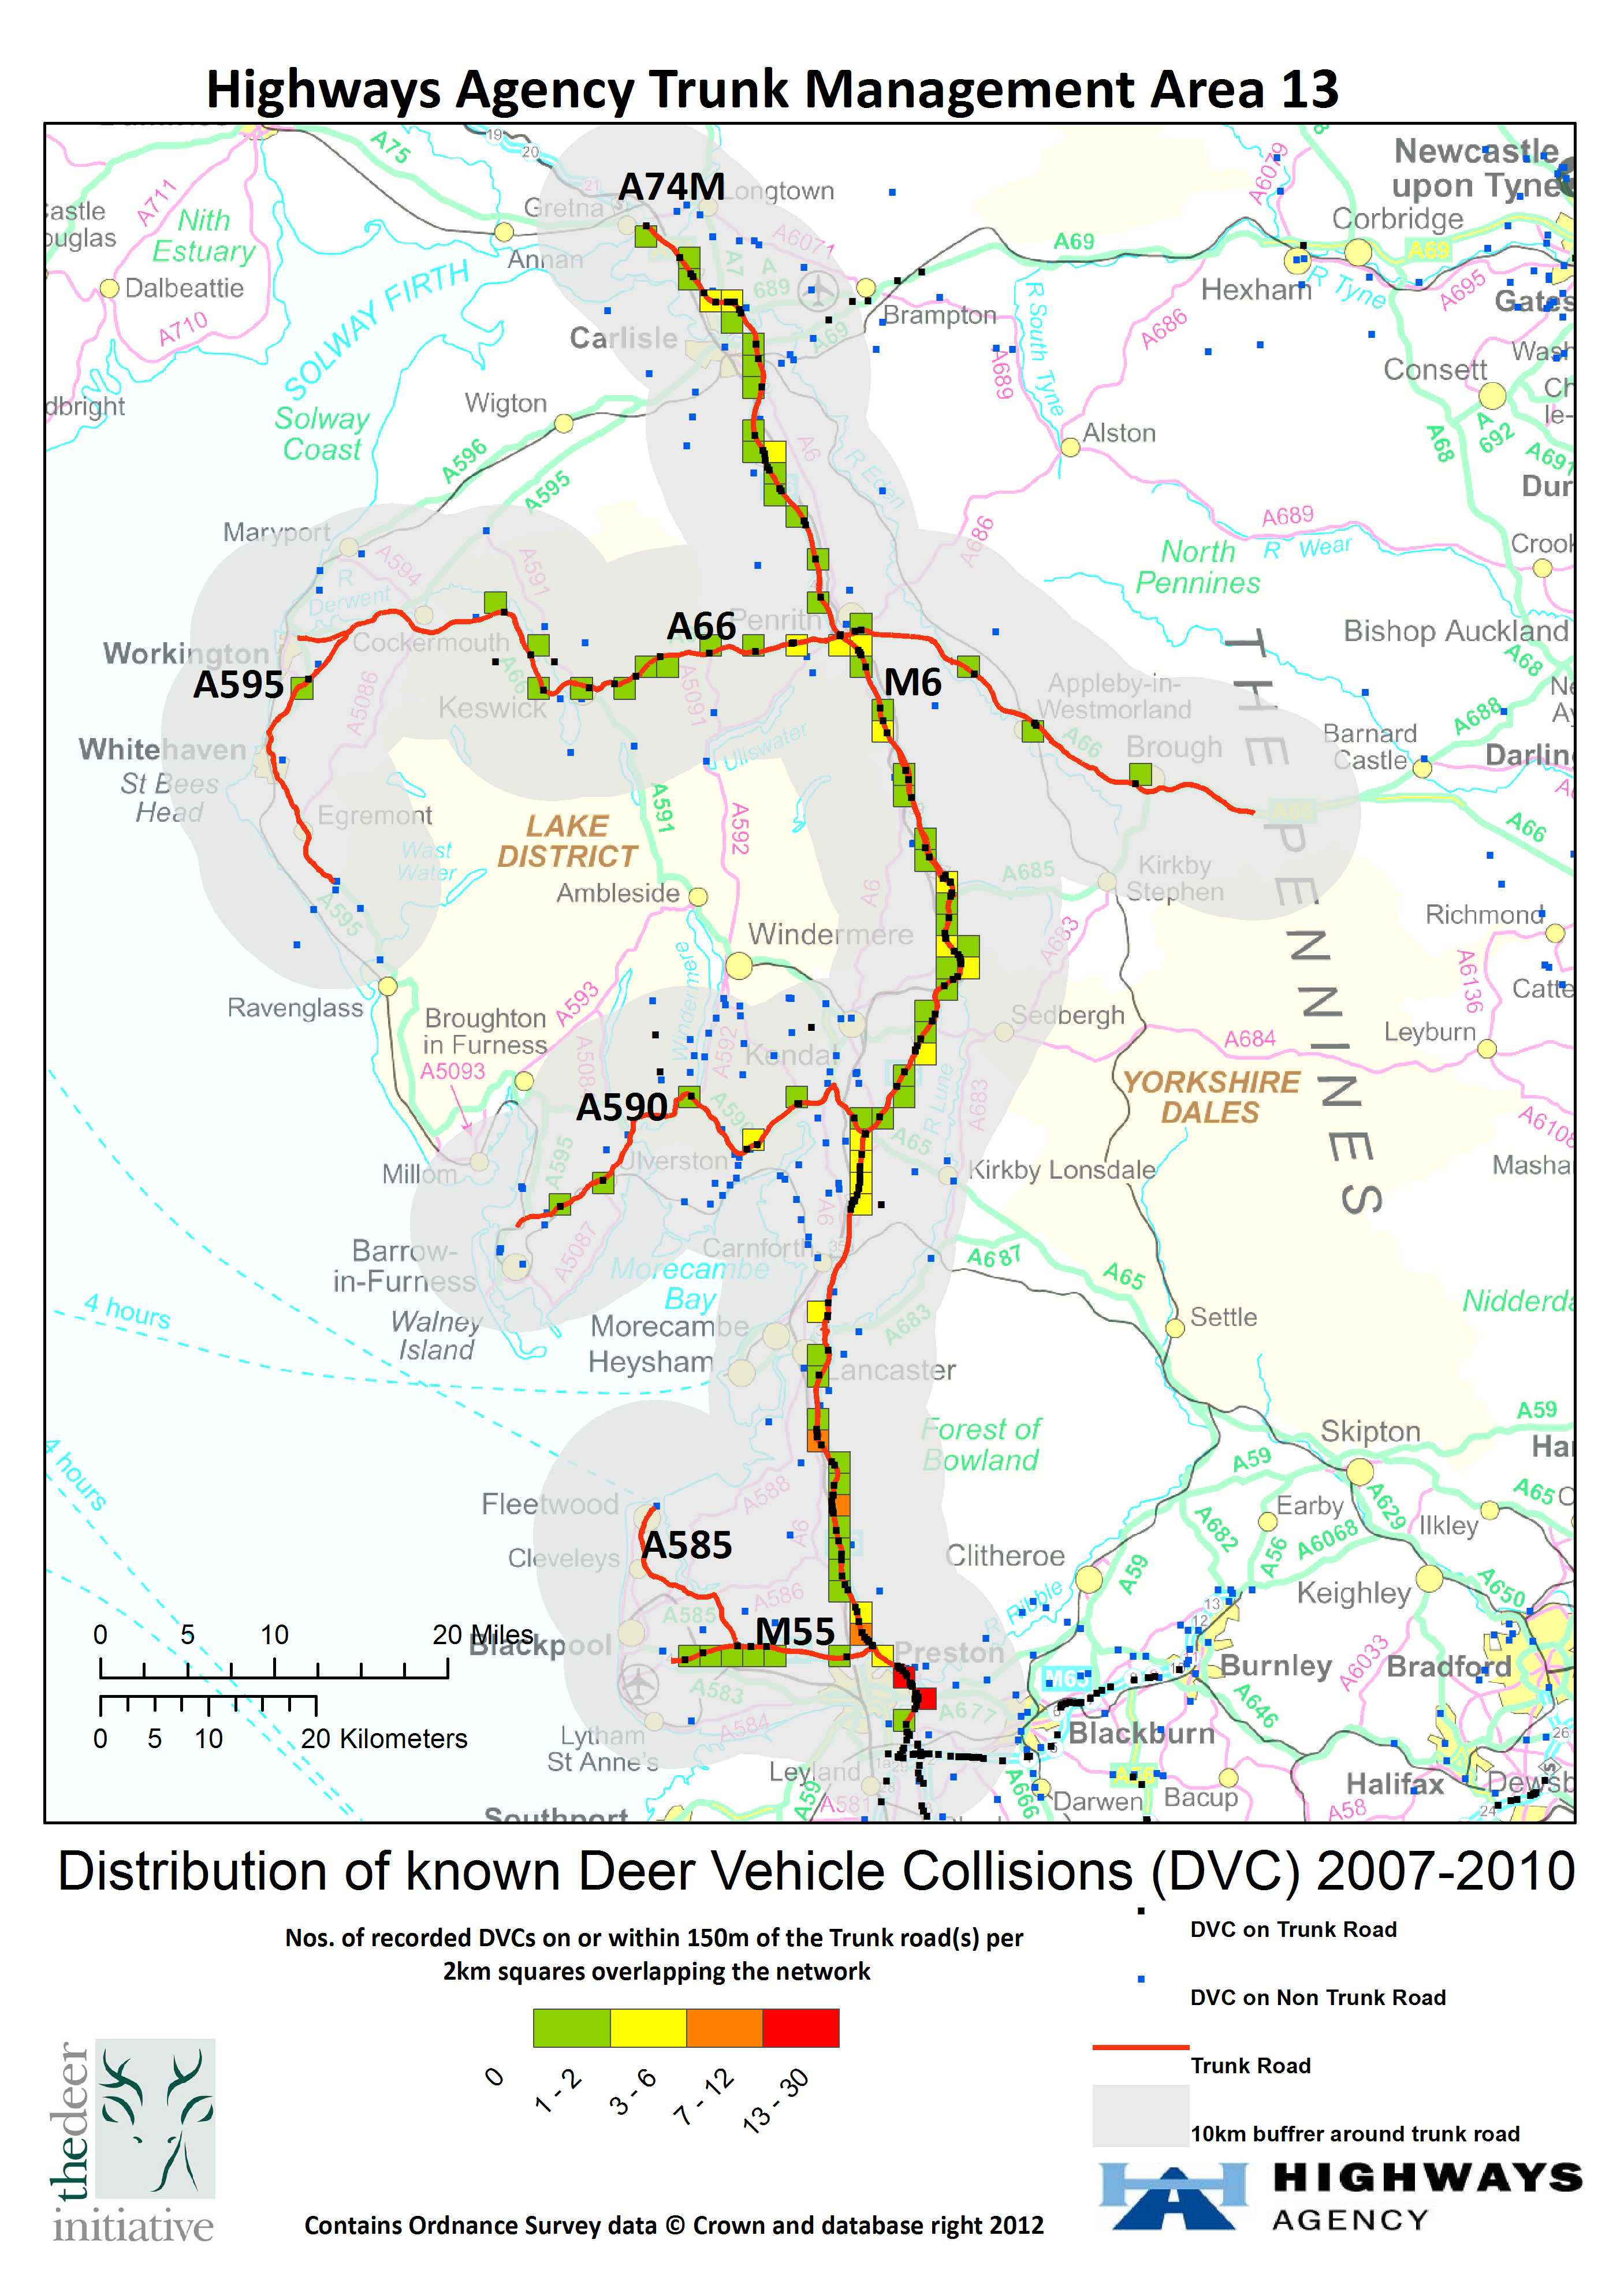
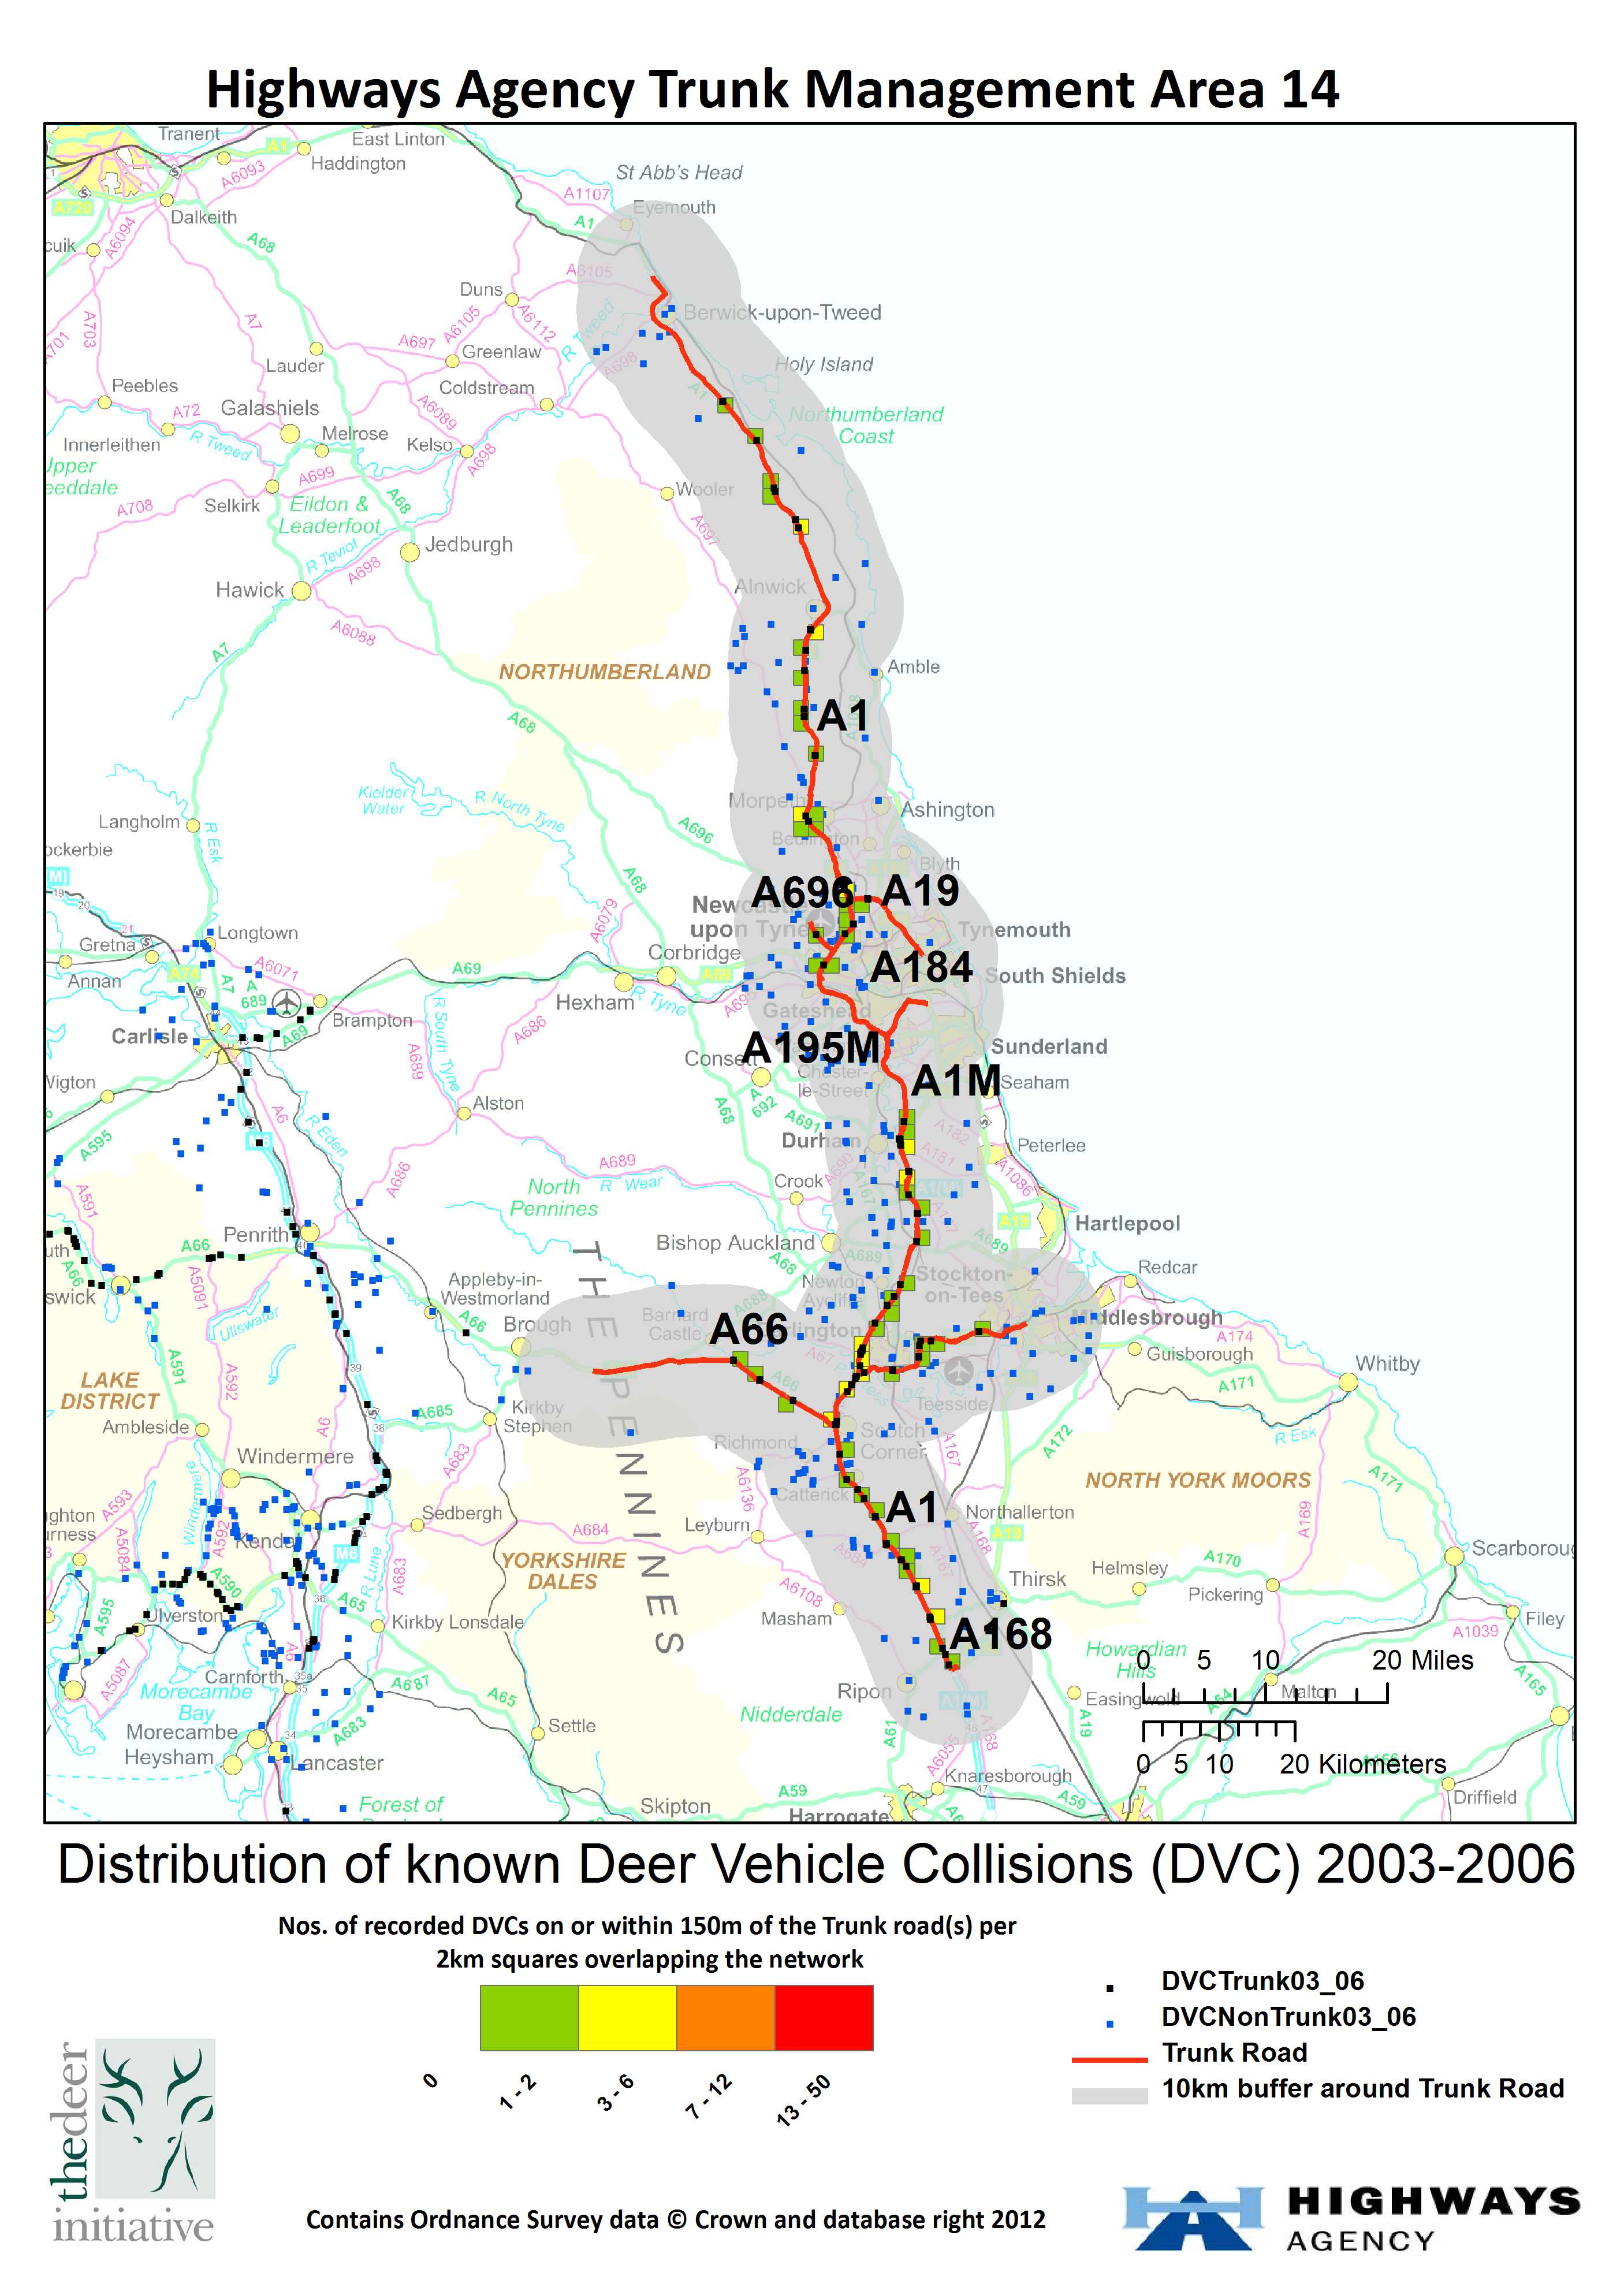
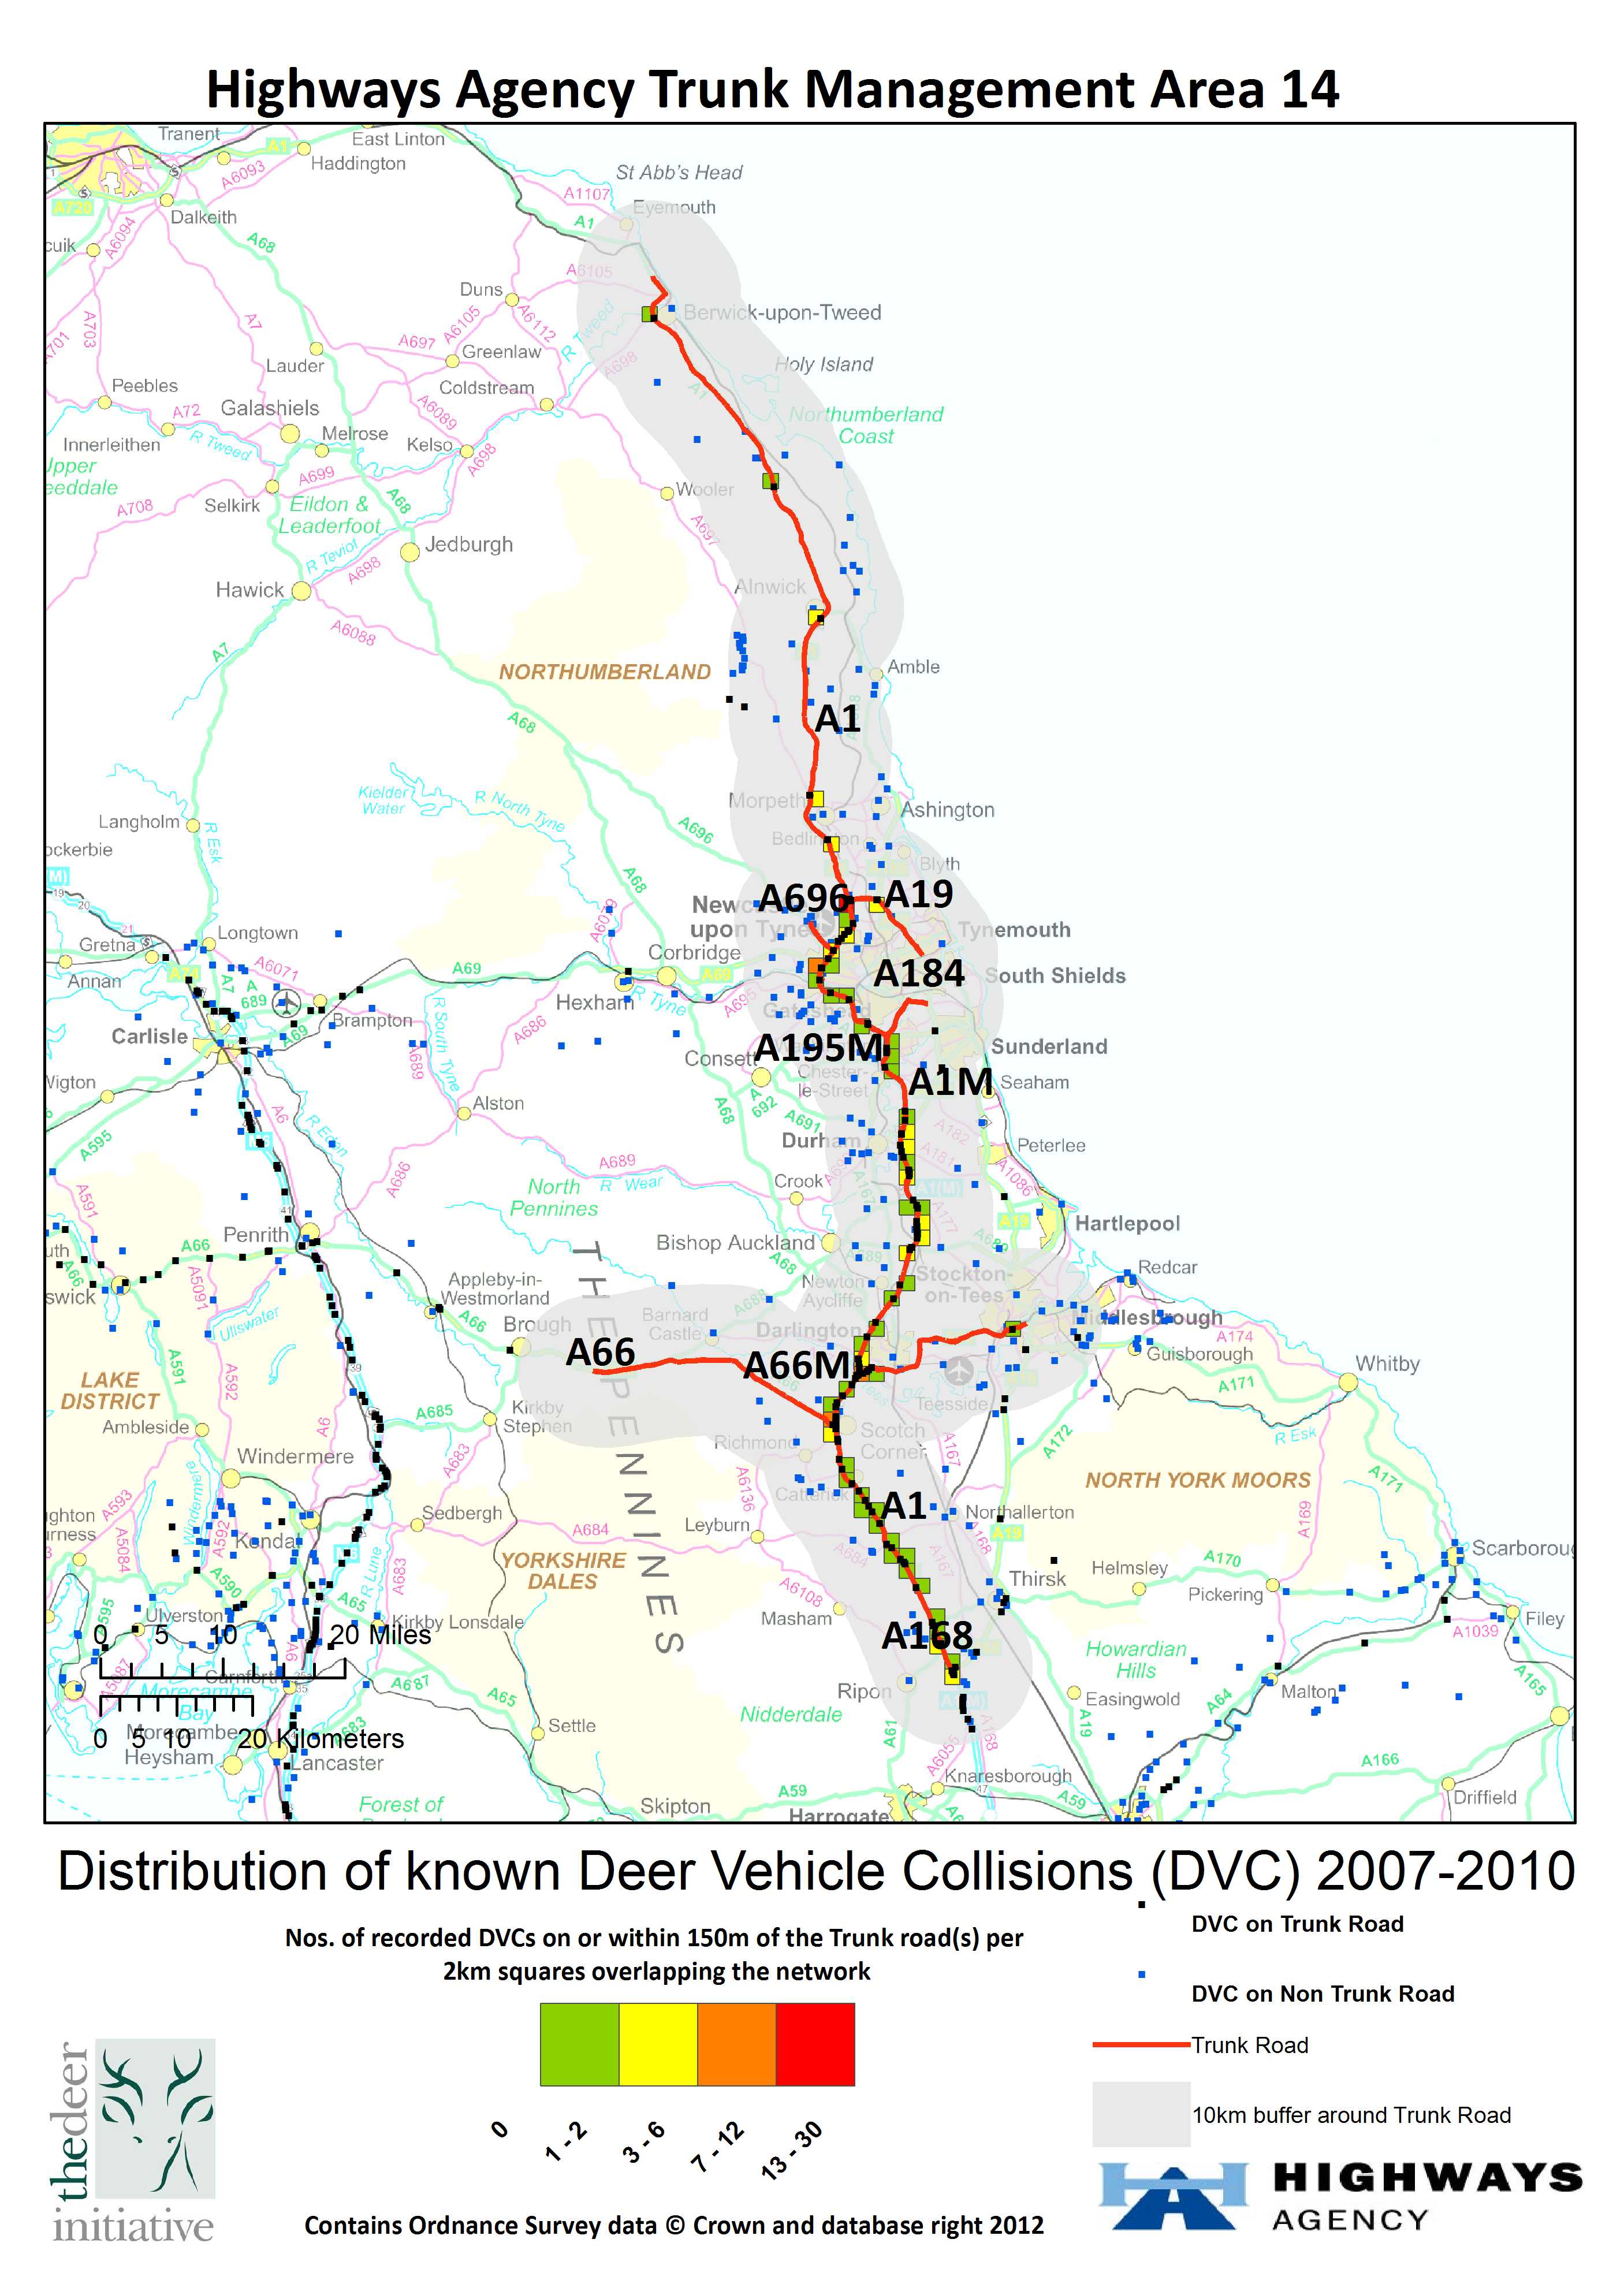
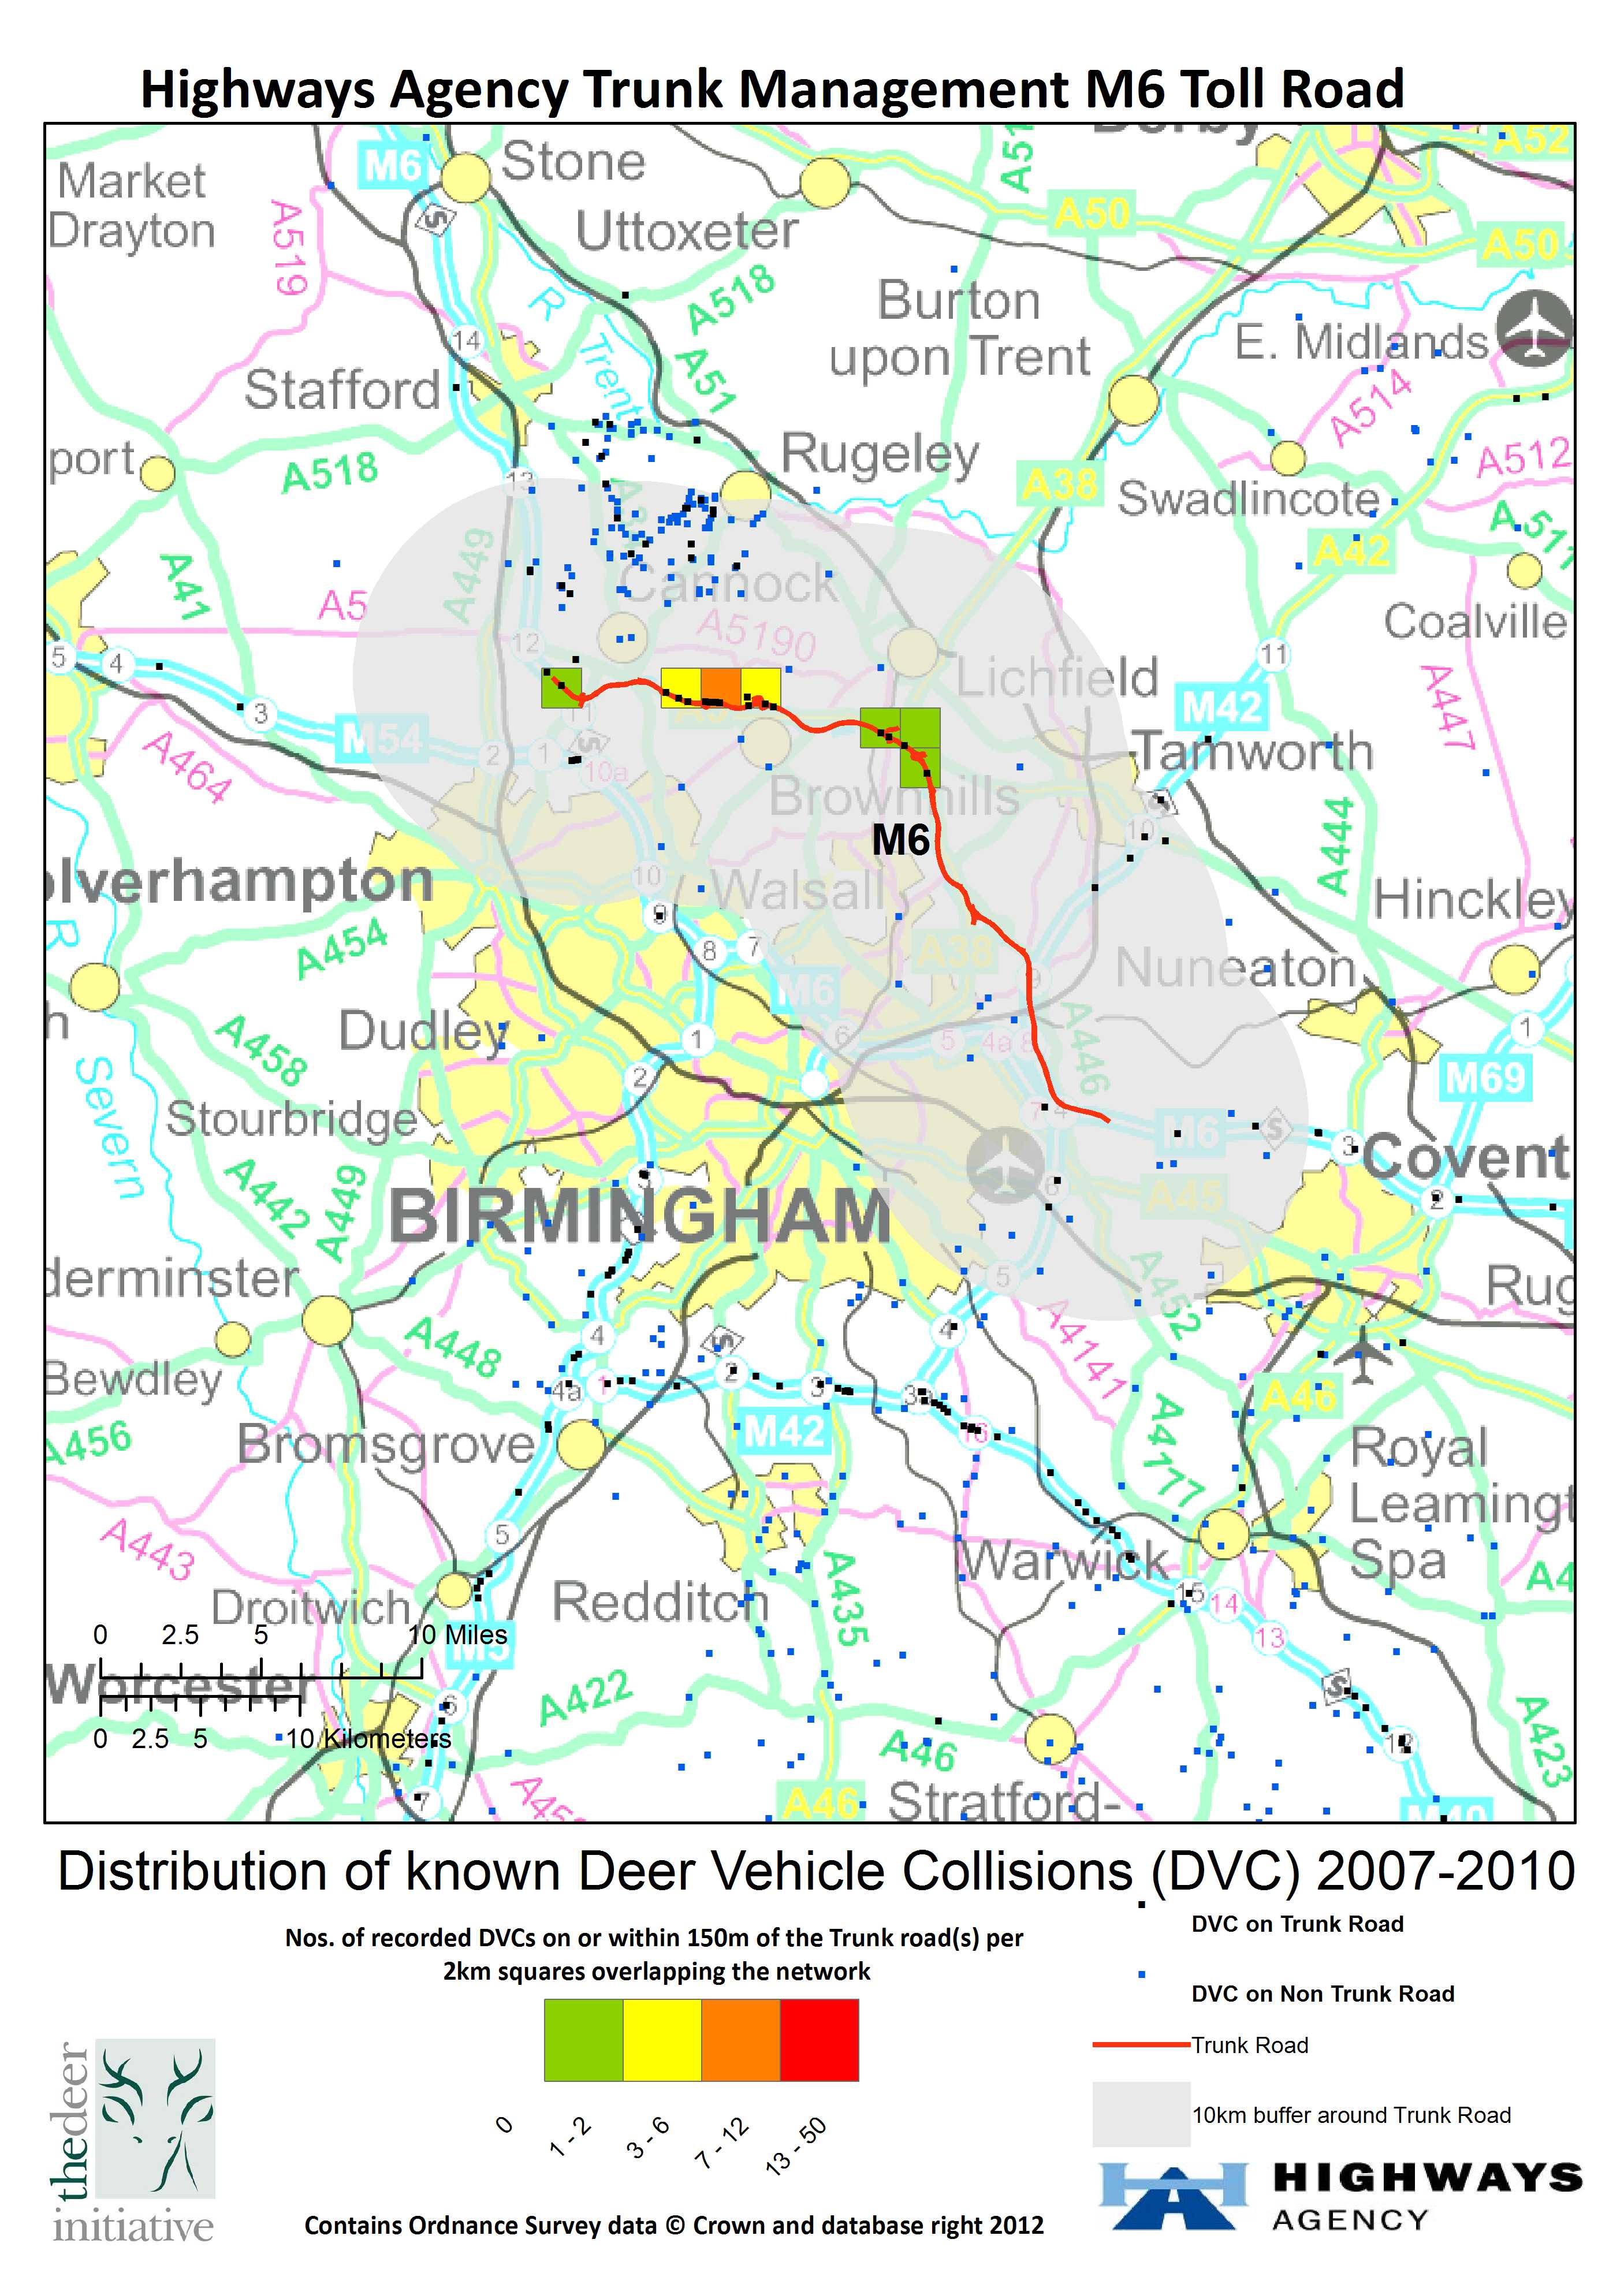
Distribution and relative frequency of DVC records 2003-2010 collated by the DI DVC project
within different HA Trunk Road Management Areas .
Individual Area Maps accessible via the links below pertain foremost to the National Trunk Road Network England managed by the Highways Agency (click  thumbnail to enlarge).
The frequency of deer casualties or related vehicle collisions recorded for trunk roads is shown by grid squares of differing colours overlaid on the trunk network only; for context other locations where either a single or multiple DVCs incident have been reported on non-trunk roads are shown as point data (pink dots) within buffer areas of 6.2 Miles (10km) to either side of the trunk network in each network management area.
For further explanatory notes about the maps click : Read_me File.
For individual maps click below - Or you can download a pdf (14MB) containing all 34 Maps here.
(Area Maps based on trunk network map boundaries as at July 2009)
HA Area 1 2003-6 / HA Area 1 2007-10
HA Area_2 2003-6 / HA Area 2 2007-10
HA Area 3 2003-6 / HA Area 3 2007-10
HA Area 4 2003-6 / HA Area 4 2007-10
M25 DBFO [5] & Links to GLA 2003-6 / M25 DBFO[5] & Link to GLA 2007-10
HA Area 6 2003-6 / HA Area 6 2007-10
HA Area 7 2003-6 / HA Area 7 2007-10
HA Area 8 2003-6 / HA Area 8 2007-10
HA Area_92003-6 / HA Area 9 2007-10
HA Area 10 2007-10
HA Area 12 2007-10
HA Area _13 2003-6 / HA Area 13 2007-10
HA Area_14 2003-6 / HA Area 14 2007-10
PFI_M6 Toll 2007-10
DBFO[25]A69 Newc. to Carlisle 2007-10
DBFO[26]A19 Dishforth to TyTunn. 2007-10
DBFO[27]M1_A1 Link 2007-10
DBFO[29]A1M Alc. to Ptbo. 2007-10
DBFO[30]M40_Denham to Warwick 2003-6 / DBFO[30]M40_Denham to Warwick 2007-10
DBFO[31]A417_A419 Swindon to Glo. 2007-10
DBFO[32]A30_A35 Exeter to Bere Regis 2007-10
DBFO[33]A1 Darrington to Disforth 2007-10
![M25 DBFO [5] & Links to GLA 2003-6](../ftp/DI%20England%20Monitoring%20DVCs%20to%202010/HAareaMaps2003_2010/HA_5a%20DBFO%20M25%202003-2006.jpg)
![M25 DBFO[5] & Link to GLA 2007-10](../ftp/DI%20England%20Monitoring%20DVCs%20to%202010/HAareaMaps2003_2010/HA_5b%20DBFO%20M25%202007-2010.jpg)
![DBFO[25]A69 Newc. to Carlisle 2007-10](../ftp/DI%20England%20Monitoring%20DVCs%20to%202010/HAareaMaps2003_2010/HA_25%20DBFO%20A69%202007-2010.jpg)
![DBFO[26]A19 Dishforth to TyTunn. 2007-10](../ftp/DI%20England%20Monitoring%20DVCs%20to%202010/HAareaMaps2003_2010/HA_26%20DBFO%20A19%20Dish.%202007-2010.jpg)
![DBFO[27]M1_A1 Link 2007-10](../ftp/DI%20England%20Monitoring%20DVCs%20to%202010/HAareaMaps2003_2010/HA_27%20DBFO%20M1-A1%202007-2010.jpg)
![DBFO[29]A1M Alc. to Ptbo. 2007-10](../ftp/DI%20England%20Monitoring%20DVCs%20to%202010/HAareaMaps2003_2010/HA_29%20DBFO%20A1M%202007-2010.jpg)
![DBFO[30]M40_Denham to Warwick 2003-6](../ftp/DI%20England%20Monitoring%20DVCs%20to%202010/HAareaMaps2003_2010/HA_30a%20DBFO%20M40%202003-2006.jpg)
![DBFO[30]M40_Denham to Warwick 2007-10](../ftp/DI%20England%20Monitoring%20DVCs%20to%202010/HAareaMaps2003_2010/HA_30b%20DBFO%20M40%202007-2010.jpg)
![DBFO[31]A417_A419 Swindon to Glo. 2007-10](../ftp/DI%20England%20Monitoring%20DVCs%20to%202010/HAareaMaps2003_2010/HA_31%20DBFO%20A417%202007-2010.jpg)
![DBFO[32]A30_A35 Exeter to Bere Regis 2007-10](../ftp/DI%20England%20Monitoring%20DVCs%20to%202010/HAareaMaps2003_2010/HA_32%20DBFO%20A30%202007-2010.jpg)
![DBFO[33]A1 Darrington to Disforth 2007-10](../ftp/DI%20England%20Monitoring%20DVCs%20to%202010/HAareaMaps2003_2010/HA_33%20DBFO%20A1%20Darr._2007-2010.jpg)